Synthetic Transactions
Two types of Synthetic Transaction Metrics are collected on the Valkey cluster – SLA metrics and local metrics.
SLA metrics are used by Instaclustr to provide a direct measure of the correct functioning of the system as seen by a client application. These metrics highlight if a client is unable to perform read/write operations on the Valkey cluster. Rather than measuring if a specific node is unavailable, its purpose is to measure if read/writes are unavailable given the redundancy measures that Valkey provides. Additionally, recording the latency of both read and write synthetic transactions will determine the quality-of-service of a Valkey node.
On the other hand, for the purpose of troubleshooting, Local Metrics provide insights of individual master node performance. The synthetic read/write transactions are performed aiming each master node. These metrics help narrow down if a particular node is performing poorly.
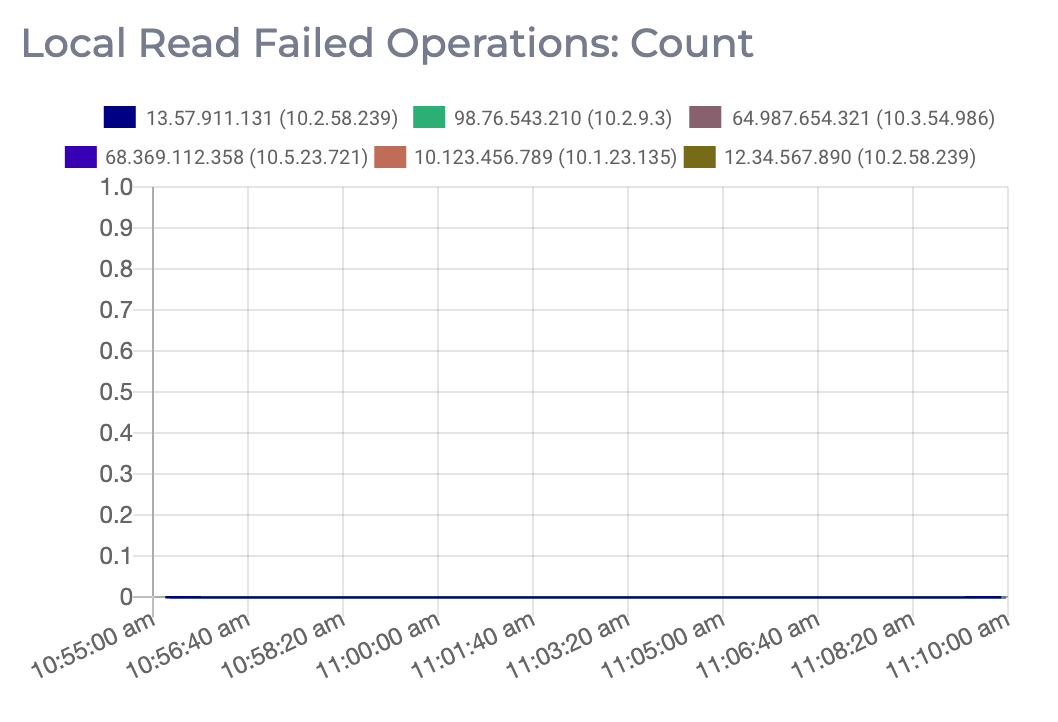
- Local Read Failed Operations: This metric shows number of failed read operations performed on the local node. Expected value: 0
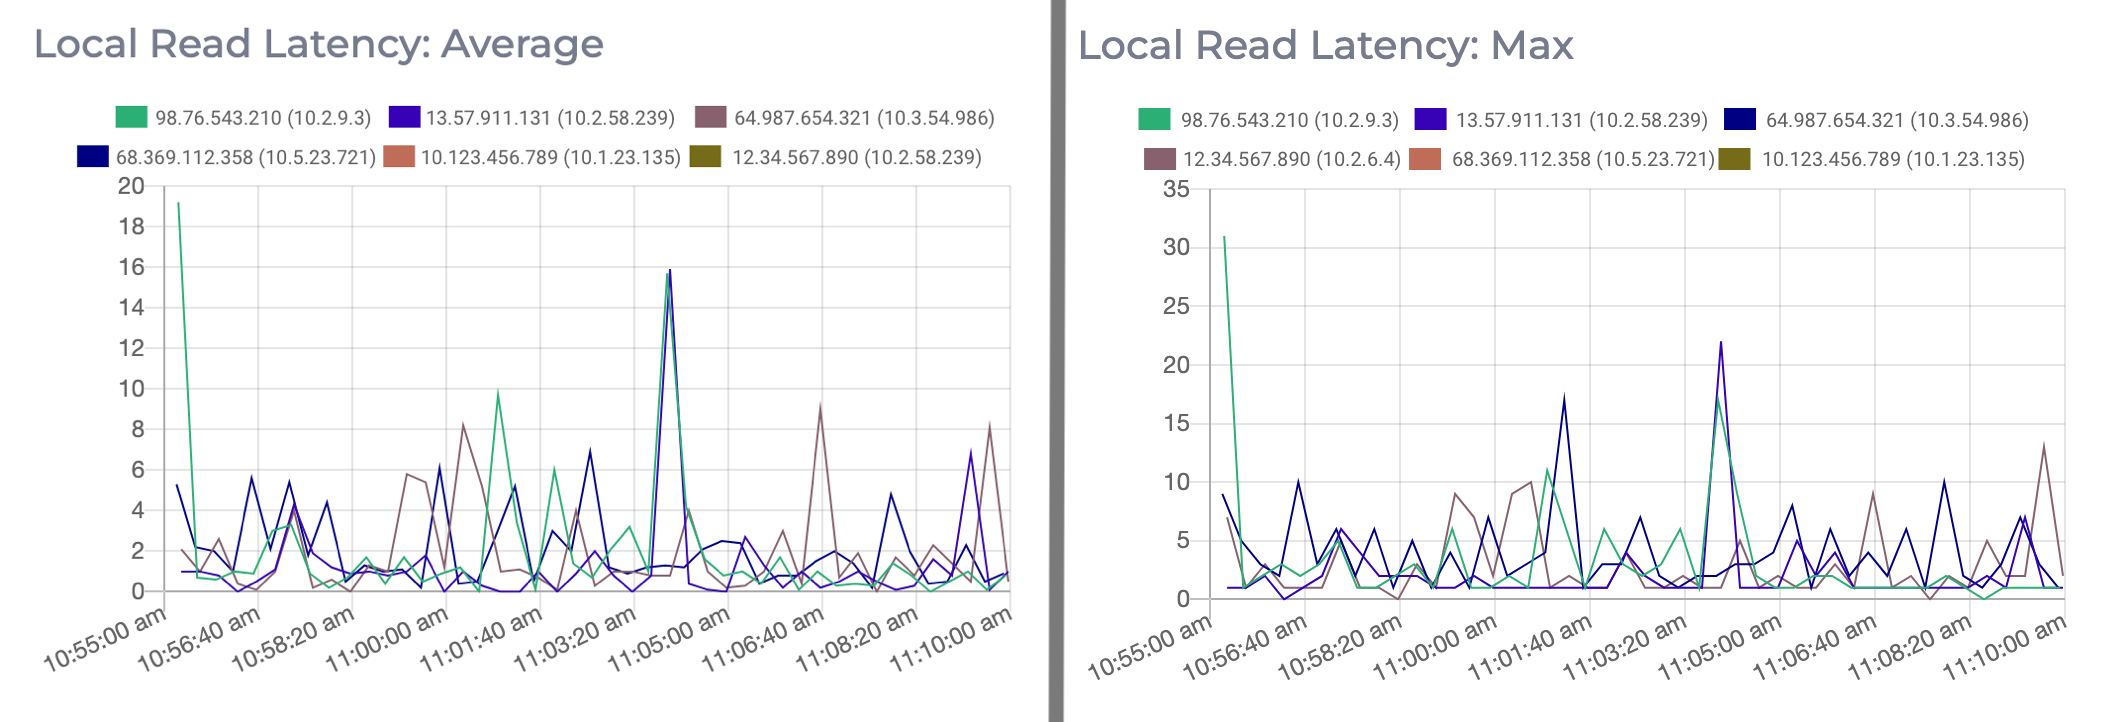
- Local Read Latency: This metric displays the average and maximum time taken in milliseconds by a client to read from its local node.
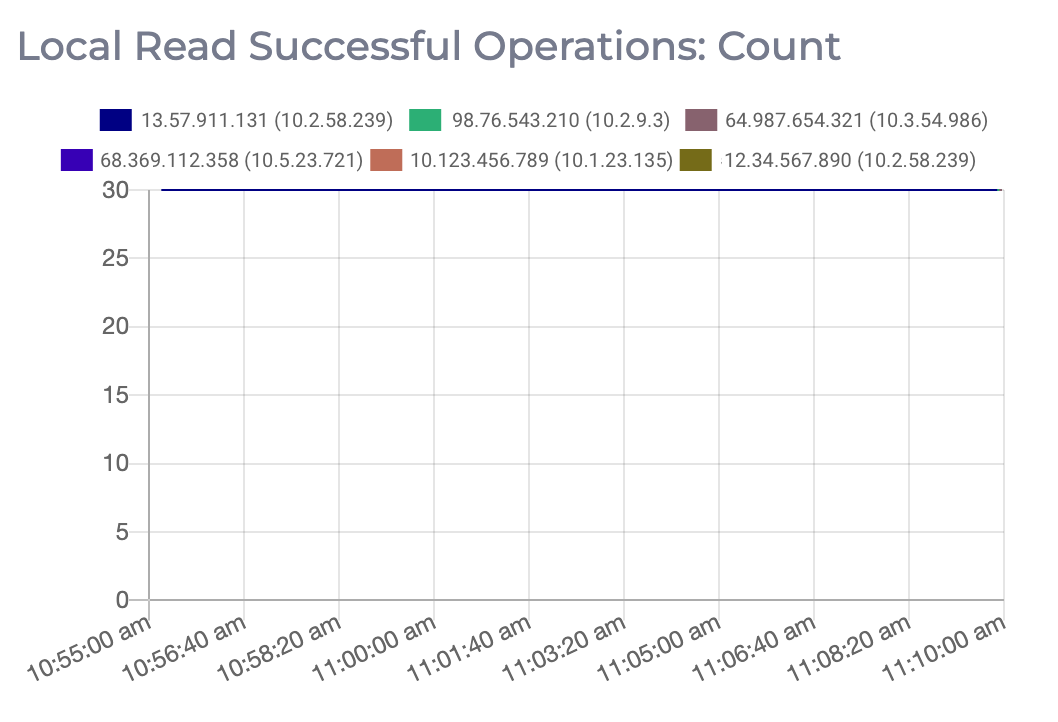
- Local Read Successful Operations: This metric shows number of successful read operations performed on the local node. Every 20 seconds, 30 synthetic read transactions are performed on each node. Expected value: 30
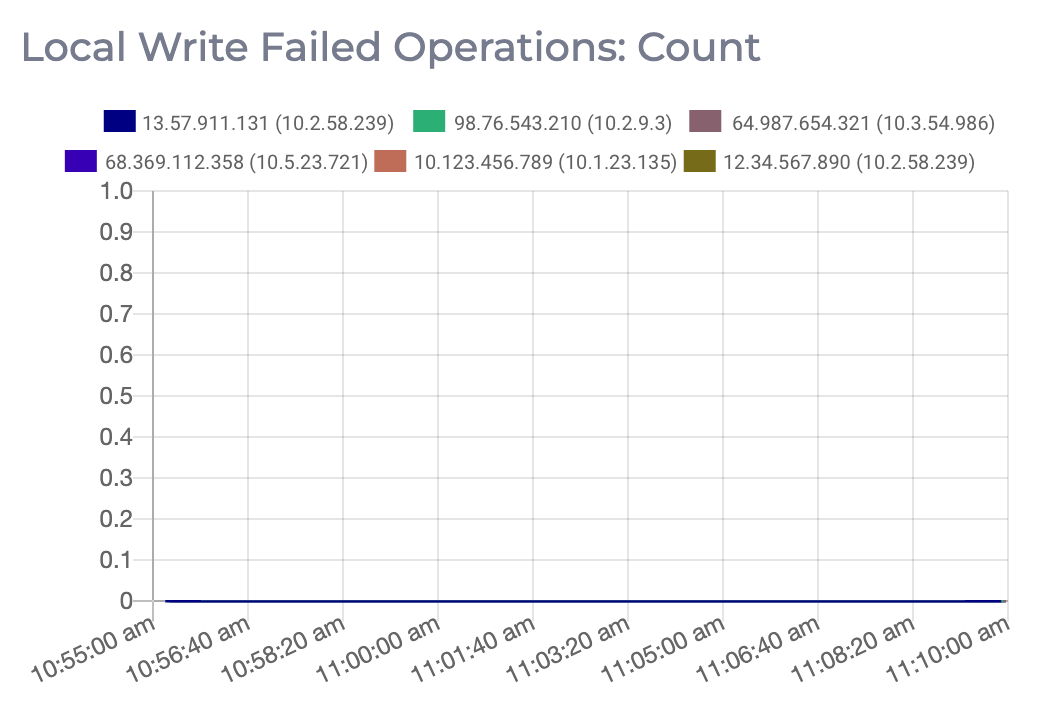
- Local Write Failed Operations: This metric shows number of failed write operations performed on the local node. Expected value: 0
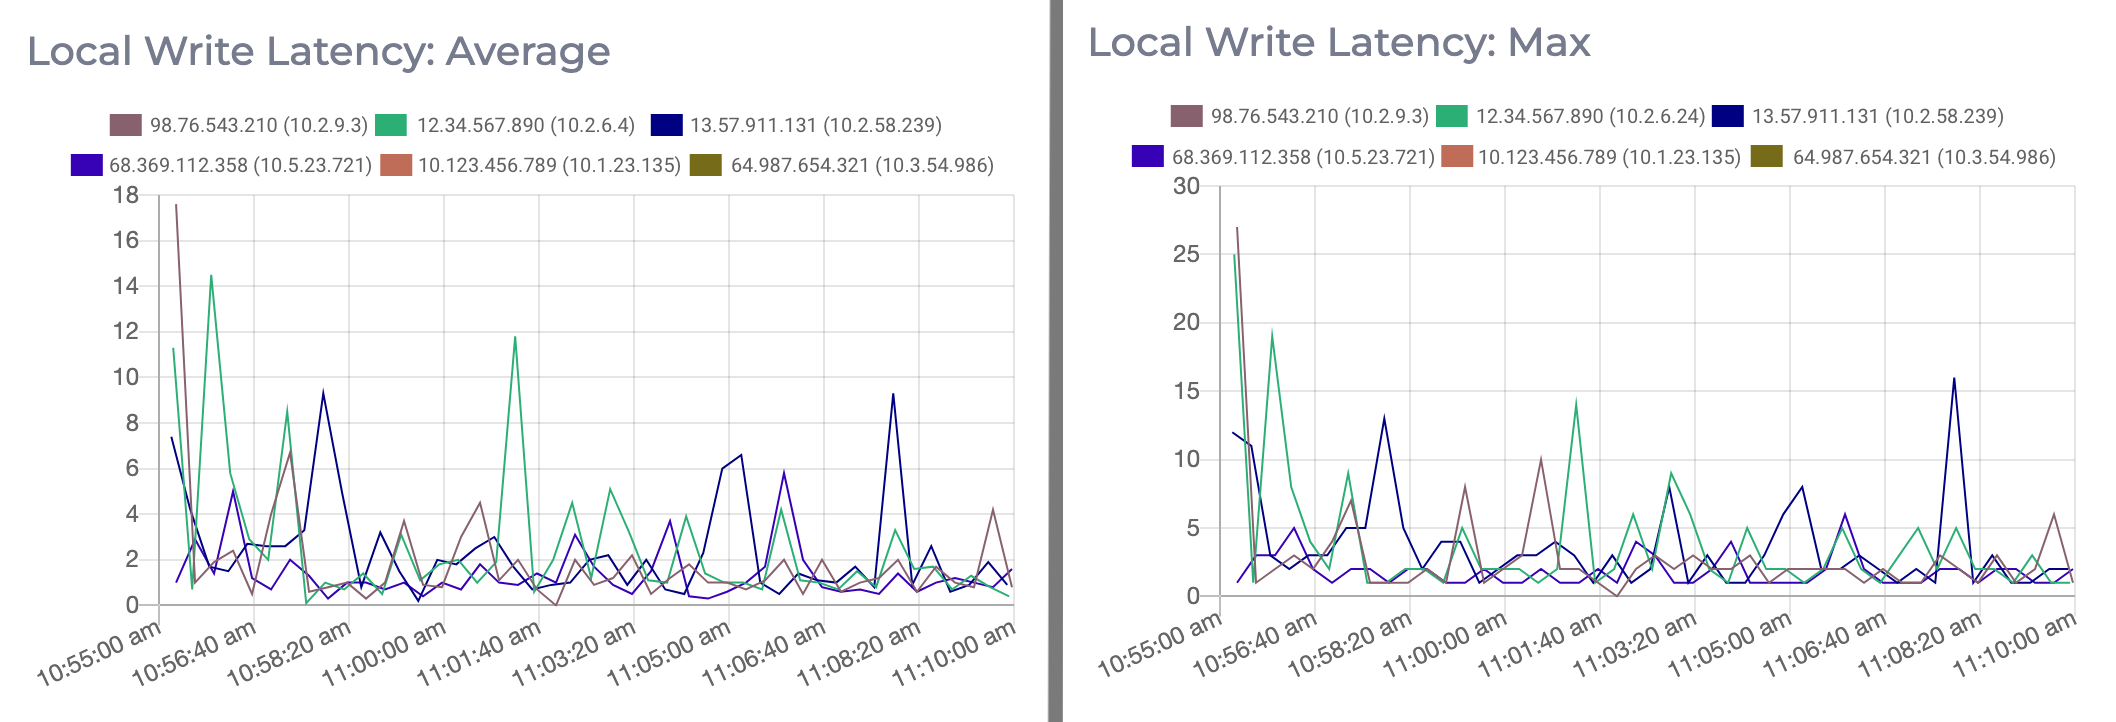
- Local Write Latency: This metric displays the average and maximum time taken in milliseconds by a client to write to its local node.
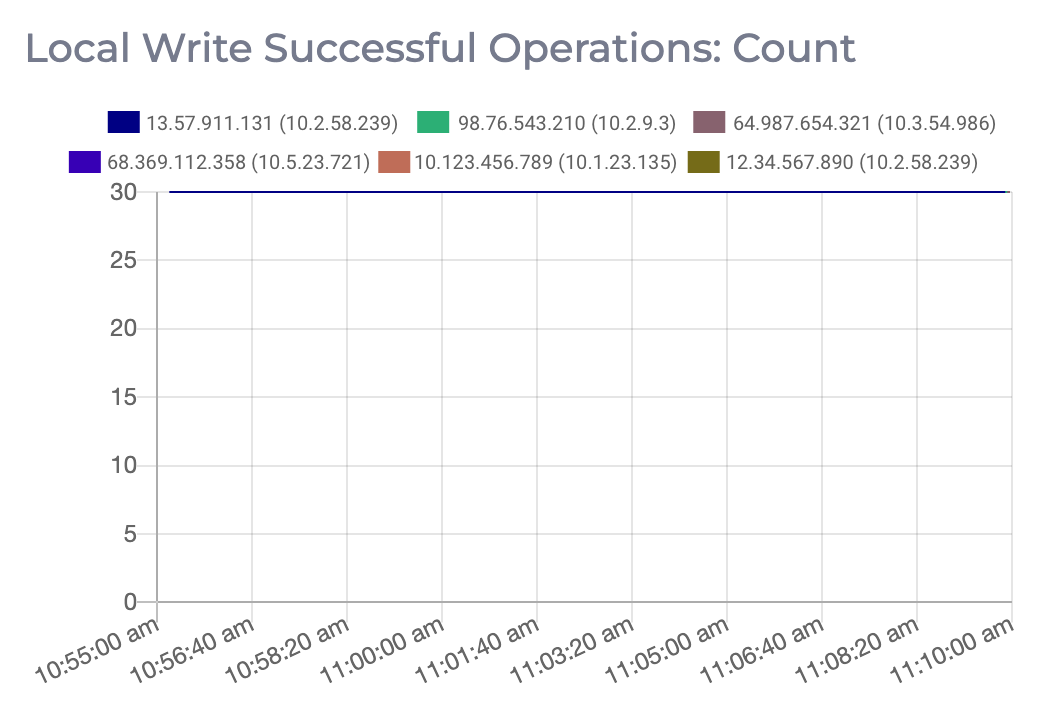
- Local Write Successful Operations: This metric shows number of successful write operations performed on the local node. Every 20 seconds, 30 synthetic write transactions are performed on each node. Expected value: 30
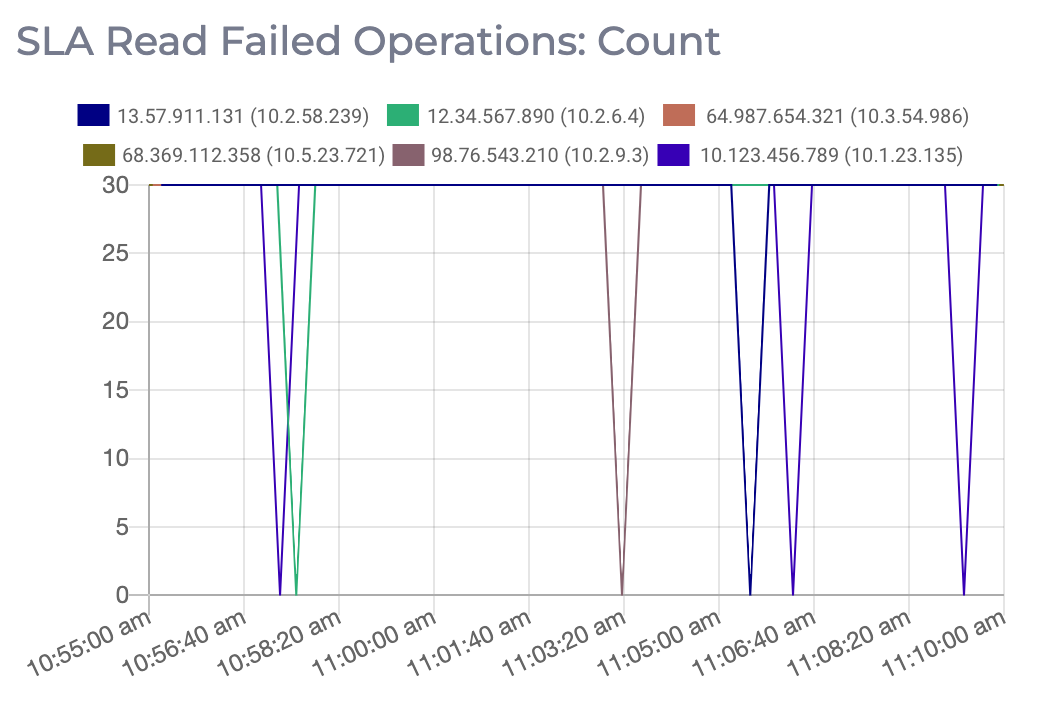
- SLA Read Failed Operations: This metric shows number of failed read operations performed on the cluster. Expected value: 0
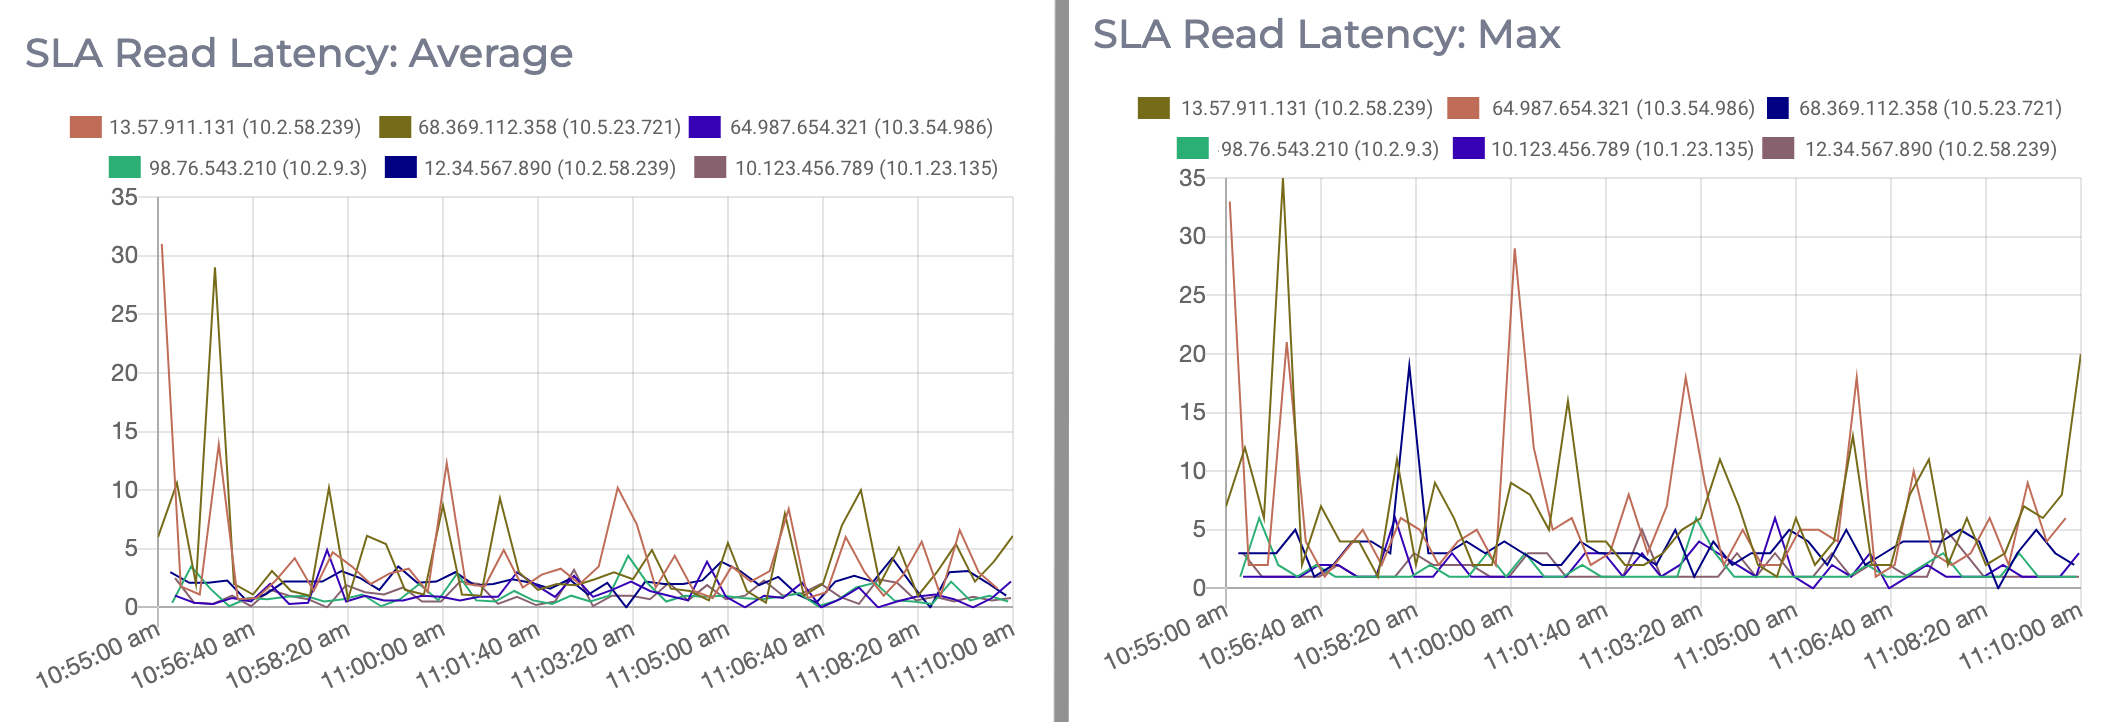
- SLA Read Latency: This metric displays the average and maximum time taken in milliseconds by a client to read from a random node in the cluster.
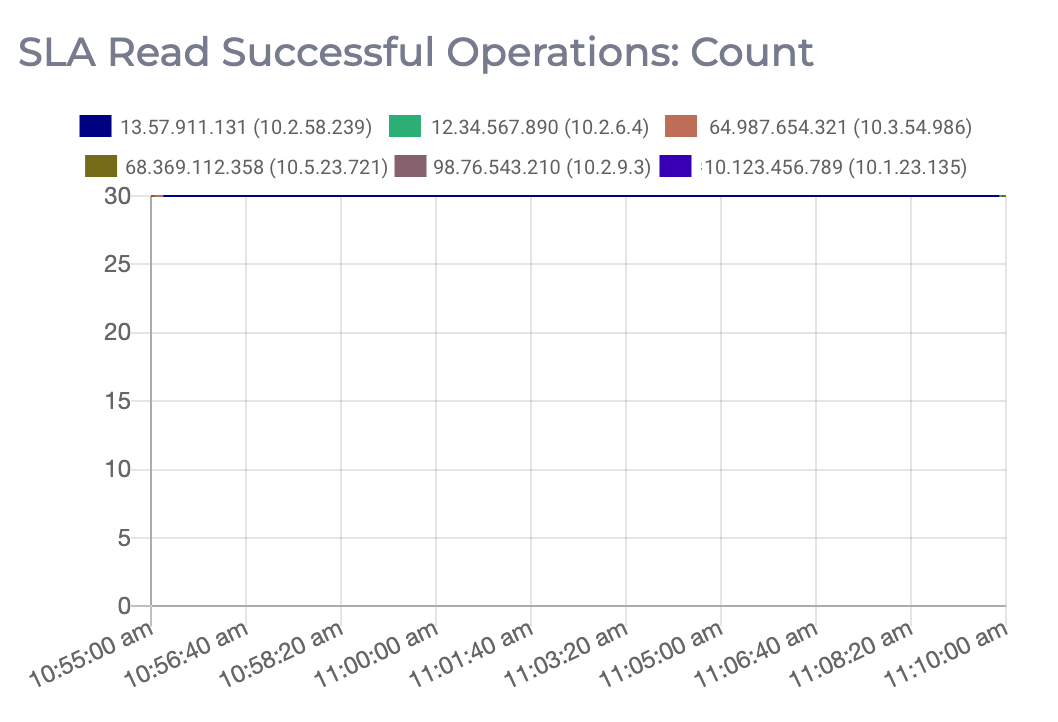
- SLA Read Successful Operations: This metric shows number of successful read operations performed on the cluster. Every 20 seconds, 30 synthetic read transactions are performed on each node. Expected value: 30
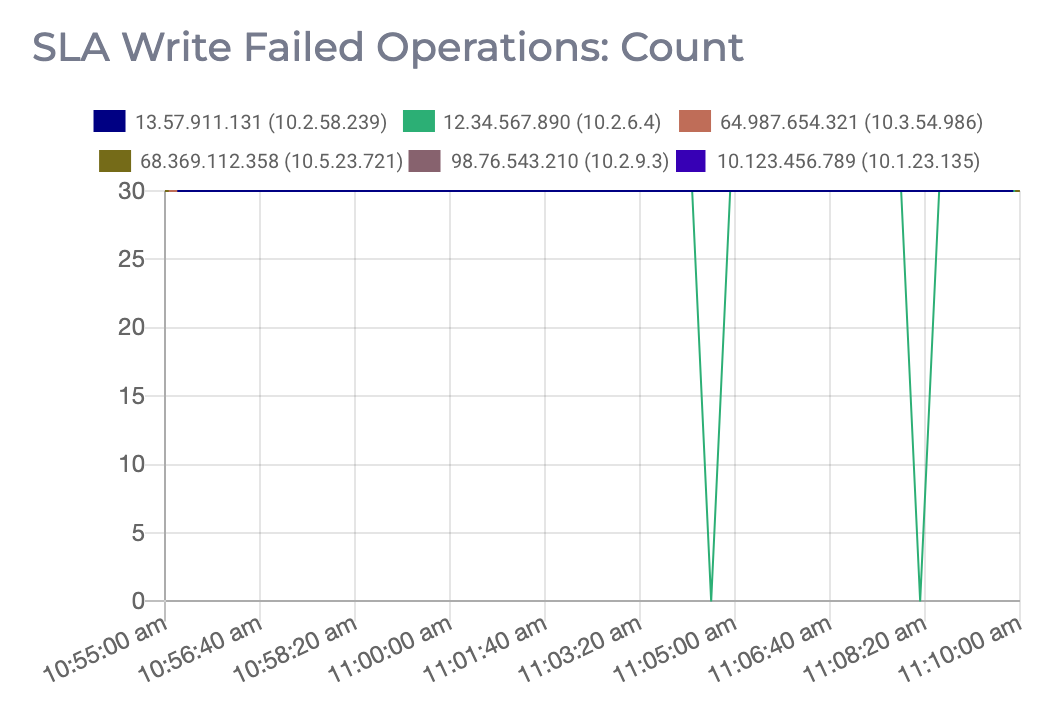
- SLA Write Failed Operations: This metric shows number of failed write operations performed on the cluster. Expected value: 0
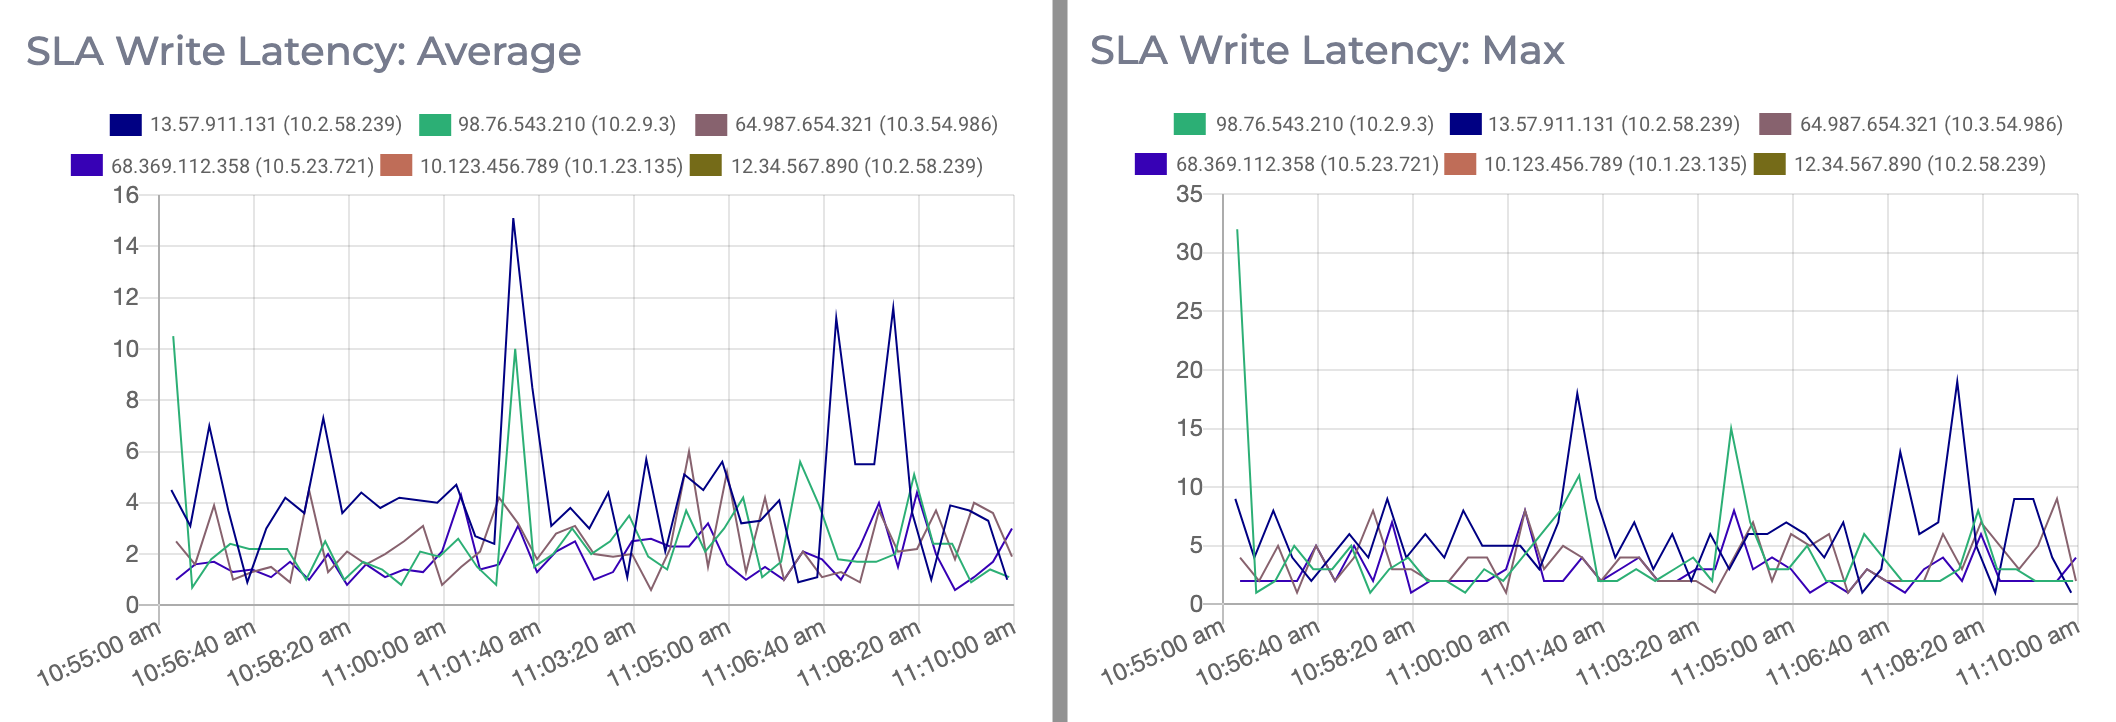
- SLA Write Latency: This metric displays the average and maximum time taken in milliseconds by a client to write to a random master node in the cluster.
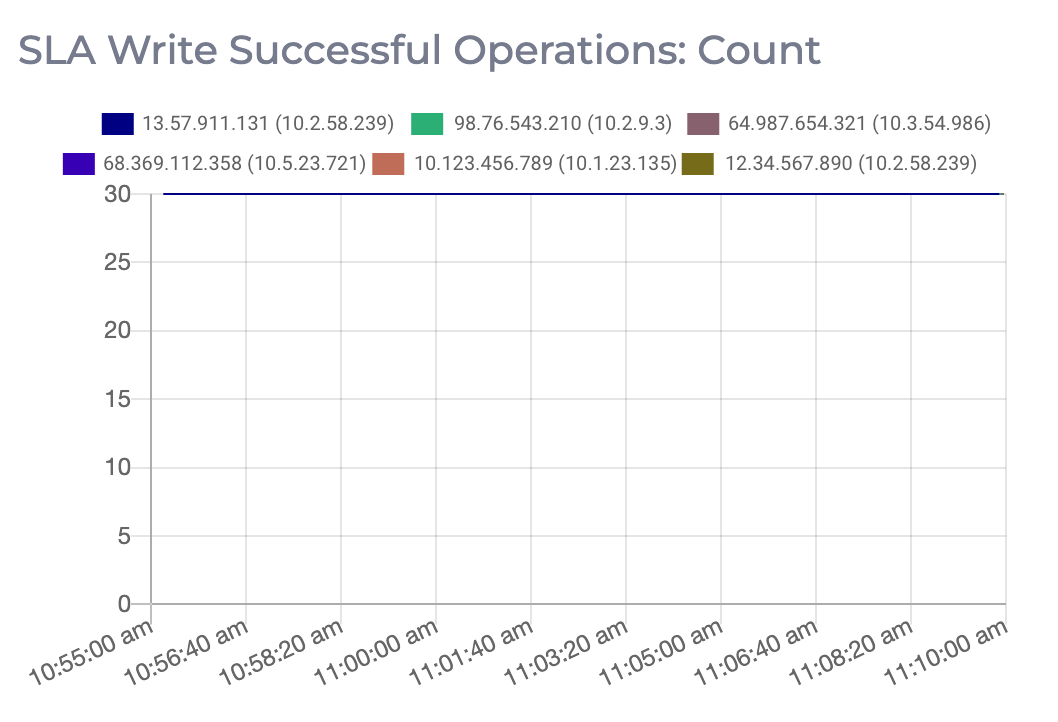
- SLA Write Successful Operations: This metric shows number of successful write operations performed on the cluster. Every 20 seconds, 30 synthetic write transactions are performed on each node. Expected value: 30