The Monitoring Page
The Instaclustr console provides a comprehensive interface to display detailed monitoring information about your cluster.
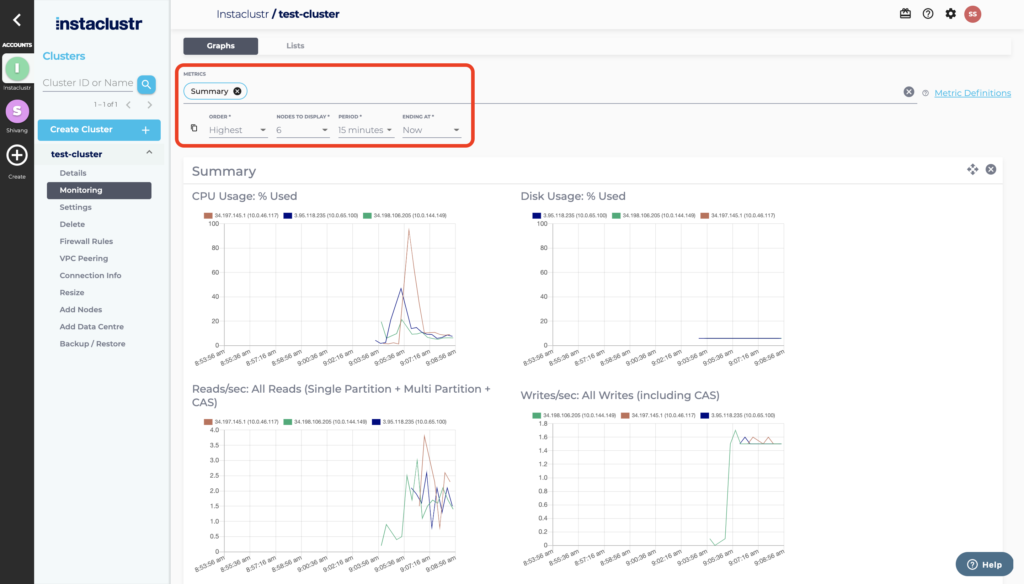
First navigate to the Monitoring page of your cluster on the Instaclustr console. There are several settings that you can modify to display the information according to your needs.
- The Metrics field can be used to specify a number of metric groups. Clicking on the field will show a dropdown menu of all the available metric groups that you can view information for.
- The preselected Summary metric group will show graphs for CPU usage, Disk usage, and the number of Reads and Writes for the nodes in your cluster.
- You can find more information about each of the different metric groups from our Monitoring Metrics Documentation.
- The Order setting has three options: Highest, Lowest, and Aggregate. Specifying either Highest or Lowest will select the highest or lowest nodes to be displayed according to how they perform against the metric for that graph. The Aggregate setting will display the minimum, maximum and average values for the metric across all the nodes in the cluster.
- The Nodes to Display setting is used to specify the number of nodes on each graph, where the nodes are chosen according to the Order specified.
- The Period setting is used to specify the period of time for which the graphs should be scaled, ending at the date and time specified under Ending At.
There is also a copy icon to the left of the menu bar which will copy a shareable URL to the clipboard for the selected configurations.

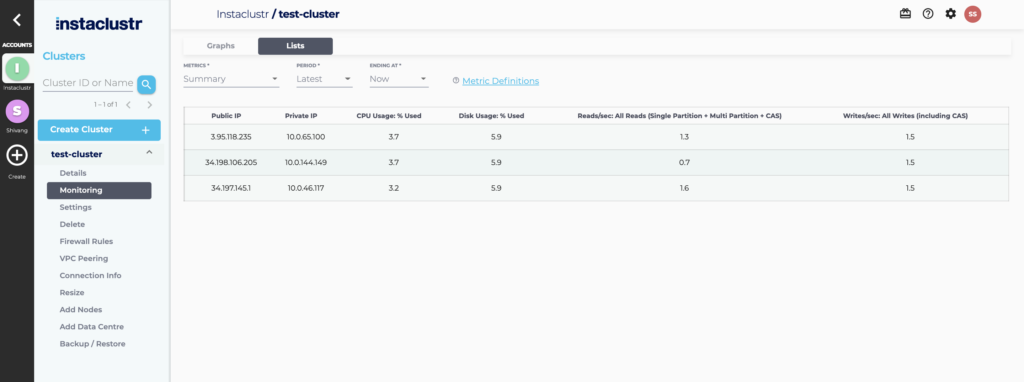
If you wish to view the information in a list format, you can select the Lists tab at the top of the page. Here, you have the option to specify a metric group and time period over which the metrics should be calculated.

For information on how to monitor your cluster via the Instaclustr Monitoring API, refer to our support article on the Instaclustr Monitoring API.
 By Instaclustr Support


