CPU Metrics
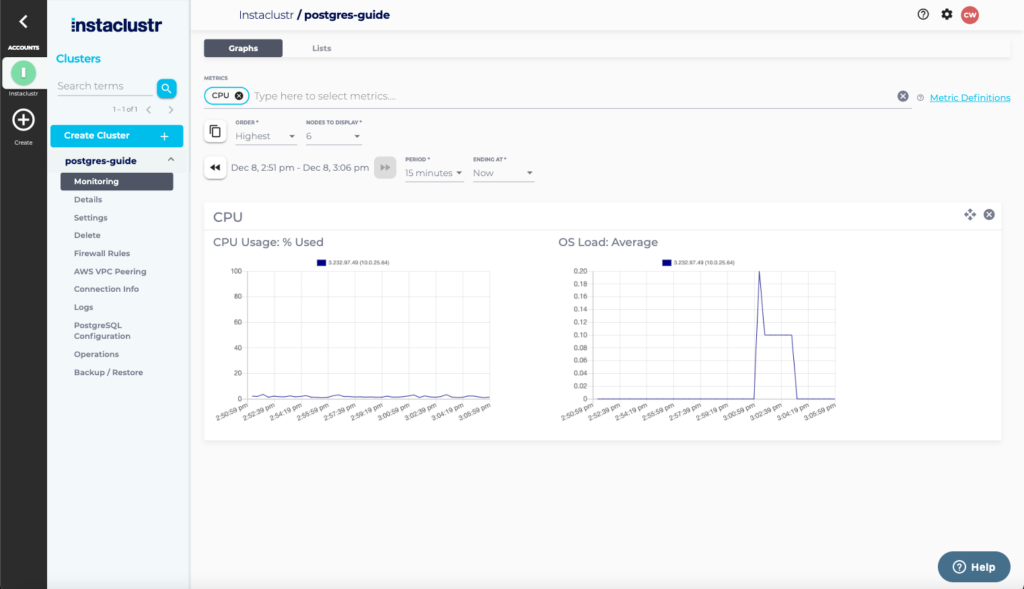
The CPU metric group contains metrics regarding the CPU utilisation of the cluster. The metrics available are:
- CPU Usage: % Used
- OS Load: Average
CPU Usage
The CPU usage metric shows the percentage of CPU utilised on your node. The percentage shown is the percentage of total CPU available (i.e. the maximum possible is 100% no matter how many CPU cores in the node).
High CPU usage is one indicator of a node reaching the limits of its processing capacity.
If you are experiencing consistently high CPU usage and not reaching the desired throughput on your PostgreSQL cluster you may need to increase the size of the nodes in your cluster.
OS Load
The OS Load metric shows the average OS load of the nodes in the cluster. Generally, a node is overloaded if the OS Load is greater than or equal to the number of cores on the node. An OS load that is temporarily greater than the number of cores on the node is normal, and indicates that the node was temporarily overloaded but managed to recover. If your OS load is consistently high you may need to increase the size of the nodes in your cluster.
 By Instaclustr Support


