Network and Request Handler Capacity
The Network and Request Handler Capacity metric group contains metrics regarding the amount of time the request handlers and network processors are idle. The metrics available are:
- Network Processor Idle Percent
- Request Handler Idle Percent
Note: since Kafka 2.2, these metrics only represent data plane network and request handler, because control plane is separated from data plane.
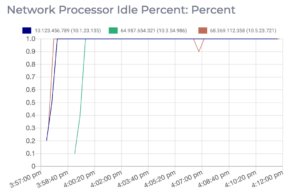
Network Processor Idle Percent
The Network Processor Idle Percent metric displays the percentage of time (expressed as a number from 0-1) that the network processors are idle. Kafka’s network processor threads are responsible for reading and writing data to Kafka clients across the network. As the job performed by the network processor threads is not very computationally intensive, the idle ratio of the network processor threads is generally not a concern. ideally the ratio should remain higher than 0.2 (20%).
Expected value: more than 0.2 (20%)

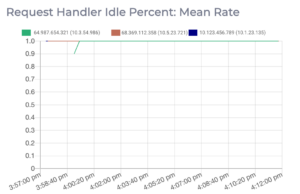
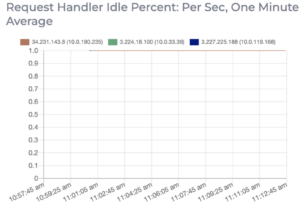
Request Handler Idle Percent
The Request Handler Idle Percent metric displays the mean rate, and the per second rate averaged over the past minute, of the percentage of time (expressed as a number from 0-1) that Kafka’s request handler threads are idle. Kafka’s request handler threads are responsible for servicing client requests, including reading and writing messages to disk. If the request handler threads get overloaded, the time taken for requests to complete will be longer. If the request handler idle percent is constantly below 0.2 (20%), your cluster is likely overloaded and requires a capacity increase. This can be achieved by either adding new nodes to the cluster or upgrading the individual nodes in the cluster. See here for more information on expanding your cluster.
Expected value: more than 0.2 (20%)

