Answering Key Questions About the ELK Stack
Organizations are increasingly turning to the ELK Stack to search and analyze massive data volumes. ELK is an acronym derived from the three technologies that formed the initial stack: Elasticsearch, Logstash, and Kibana. Some are incorporating the stack’s search capabilities into apps and websites, providing simple, fast ways to find information. Others are employing the ELK Stack to monitor the performance, availability, and security of apps and infrastructure by analyzing data from a growing number of sources.
But what is the ELK Stack? Why are the component technologies so popular? And what are some of the ways that you might use the ELK Stack in your organization?
What Is the ELK Stack?
The ELK Stack is a package of open source technologies for collecting, searching, analyzing, and visualizing large data volumes generated by diverse sources. The stack originally included only Elasticsearch, Logstash, and Kibana. But in 2015, Elastic added another open source technology: Beats. Rather than changing the acronym, Elastic now refers to the augmented stack as the Elastic Stack.
What Is Elasticsearch?
Elasticsearch is a modern, open source full-text search and analytics engine. The heart of the ELK Stack, Elasticsearch can be used for searching a full array of data types—from text, numbers, and geospatial data to other types of structured and unstructured data.
Built on the Apache Lucene library, Elasticsearch has a distributed architecture, offers simple, REST APIs, and stores data as schema-free JSON documents. It is easy to use and is scalable, enabling you to rapidly search fast-growing volumes of data.
What Is Logstash?
Logstash is an open source, server-side data processing pipeline that dynamically ingests data transforms it, and ships it to whatever location (or “stash”) you define. It can simultaneously ingest unstructured data streaming in from numerous sources—including websites, application servers, and data stores.
Logstash filters and parses the data it collects, transforming it into a common format. It then sends that data wherever you want it to go. Many organizations send the transformed data to Elasticsearch, where logs can be indexed and searched. Once data is available in Elasticsearch, it can also be visualized with Kibana.
What Is Kibana?
Kibana is an open source data analysis and visualization tool that turns the data stored in Elasticsearch into easily consumable charts, graphs, histograms, and other visual representations. Through a browser-based interface, you can use preconfigured dashboards to explore large data volumes.
Kibana provides a useful way to share insights across your organization. Non-technical users can easily see trends and assess KPIs, all through rich, customizable graphics.
What Are Beats?
An addition to the ELK Stack, Beats are lightweight, single-purpose data shippers. There are several different distinct Beats, each focused on specific types of data, including log files, metrics, network packets, Windows events, audit data, uptime monitoring data, and cloud data. The open source community is developing additional Beats.
Beats can reside on servers or be deployed as functions. Each Beat has a simple task: gather data and ship it to Elasticsearch. Shipped data conforms with the Elastic Common Schema (ECS). If data needs to be transformed, you can use an ingest pipeline or ship it to Logstash.
Instaclustr managed OpenSearch service streamlines deployment for your application. Get in touch to discuss!
Why Is the Elastic Stack So Popular?
Organizations are adopting the ELK Stack in part because Elasticsearch has become a leading choice over other search engines, including Apache Solr. Compared with other solutions, Elasticsearch can offer superior scalability, provide more powerful near-real-time search and analytics capabilities, and better support dynamic, changing data. Its native JSON-based Query DSL (domain-specific language) can also handle highly complex searches.
The ELK Stack also provides greater hosting flexibility than other stacks. You can deploy the ELK Stack on your preferred cloud provider, including AWS, Google Cloud, and Microsoft Azure. You also have the option to install components on servers running a range of operating systems—such as versions of Windows Server, CentOS, Ubuntu, and Debian. And you can run the stack in Kubernetes or Docker environments.
The fact that the ELK Stack comprises open source technologies has also contributed to its popularity. . Unlike proprietary solutions, such as Splunk, the ELK Stack lets you avoid costly licensing fees while also joining a thriving open source community that is continuously innovating.
Elastic, however, recently changed its licensing scheme for Elasticsearch and Kibana, moving away from the open source Apache 2.0 license to the more restrictive Server Side Public License (SSPL) and Elastic License. The Open Source Initiative has publicly stated that the SSPL is not an open source licence. For a true open source alternative to the Elastic distribution, organizations will need to choose the Open Distro for Elasticsearch instead of one of Elastic’s offerings. (The Open Distro for Elasticsearch will be renamed as the community managing the project manages its own fork for the Elasticsearch and Kibana codebases.)
Common Use Cases
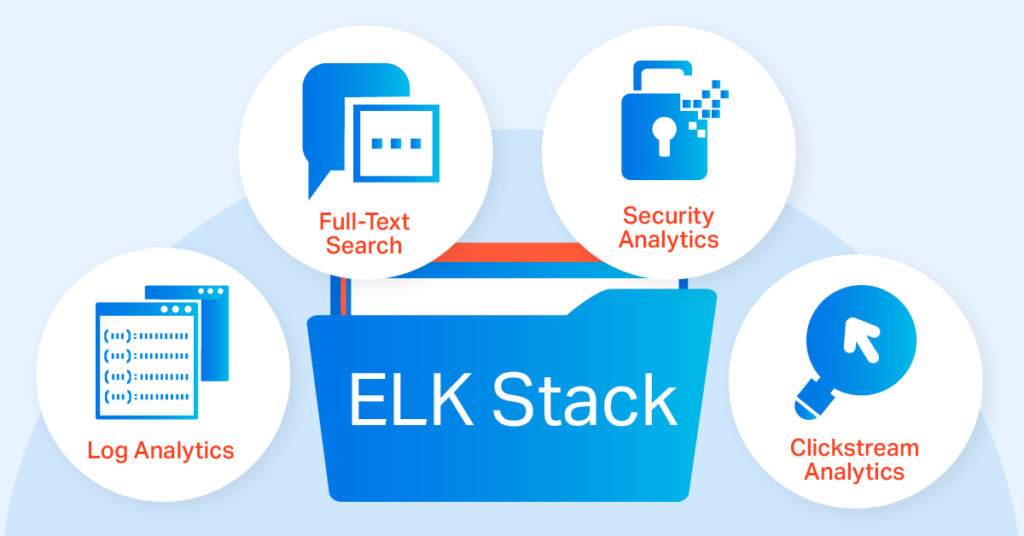
Organizations typically deploy the ELK Stack for one or more use cases related to search and analytics.
Full-Text Search: Organizations are incorporating the ELK Stack’s full-text search capabilities into apps and websites to enable users to find what they need quickly and easily. eBay, for example, uses Elasticsearch to empower users to rapidly search hundreds of millions of merchandise listings. Some organizations are also deploying Elasticsearch internally to help employees search internal knowledge bases and data.
Log Analytics: Monitoring the performance and availability of apps and infrastructure is another top ELK Stack use case. You can use the ELK Stack to analyze unstructured or semi-structured logs generated by websites, servers, sensors, and other systems. Those analyses can help you prevent issues and quickly respond to events that could cause downtime.
Security Analytics: The ELK Stack can also bolster security. You can use the ELK Stack to track threats across apps and systems in real time. Elasticsearch enables you to explore security logs in a protected environment, while Kibana can provide deep insight into trends. For many organizations, the ELK Stack is an enticing open source alternative to other SIEM (security information and event management) systems.
Clickstream Analytics: The ELK Stack can also play a key role in analyzing performance of web content and enhancing user experiences. By analyzing clickstreams, you can better understand which web pages are successful in engaging customers and then generate reports that help business groups improve their strategies.
Simplify ELK Stack Management with Instaclustr
The ELK Stack includes powerful software for collecting, analyzing, searching, and visualizing data. But managing an ELK Stack cluster can be challenging and time-consuming.
Instaclustr provides a fully managed and hosted service for open source Elasticsearch—with an optional managed Kibana node—on your preferred cloud platform. The service is based on Open Distro for Elasticsearch, which is truly open source, giving you full visibility into the code base when you use Elasticsearch for data logging, search, analytics, or other use cases. Working with us to manage your Elasticsearch cluster allows you to stay focused on your IT and business priorities instead of your data layer.
If you’d rather manage your own environment, we offer 24×7 expert support for Elasticsearch and your related data infrastructure. In addition, our Consulting team can help you design and implement your environment, perform health checks, and optimize operations so you can maximize the value of the ELK Stack going forward.
Learn more about the Instaclustr fully managed, hosted service for Elasticsearch, Elasticsearch support, and Elasticsearch consulting.
Experience the power of open source technologies by spinning up a cluster in just a few minutes.