“Nothing is so painful to the human mind as a great and sudden change.”
—Mary Wollstonecraft Shelley, Frankenstein
Now that we’ve generated a load for Apache Kafka®, it’s time for the next step: prototyping.
1. Initial Prototype
“It was on a dreary night of November that I beheld the accomplishment of my toils. With an anxiety that almost amounted to agony, I collected the instruments of life around me, that I might infuse a spark of being into the lifeless thing that lay at my feet. It was already one in the morning; the rain pattered dismally against the panes, and my candle was nearly burnt out, when, by the glimmer of the half-extinguished light, I saw the dull yellow eye of the creature open; it breathed hard, and a convulsive motion agitated its limbs.”
― Mary Wollstonecraft Shelley, Frankenstein
Deep in the bowels of the Instaclustr Laboratory, I spent many dreary days hacking together a complete prototype anomaly detection pipeline from the discarded malformed detritus of previous projects.
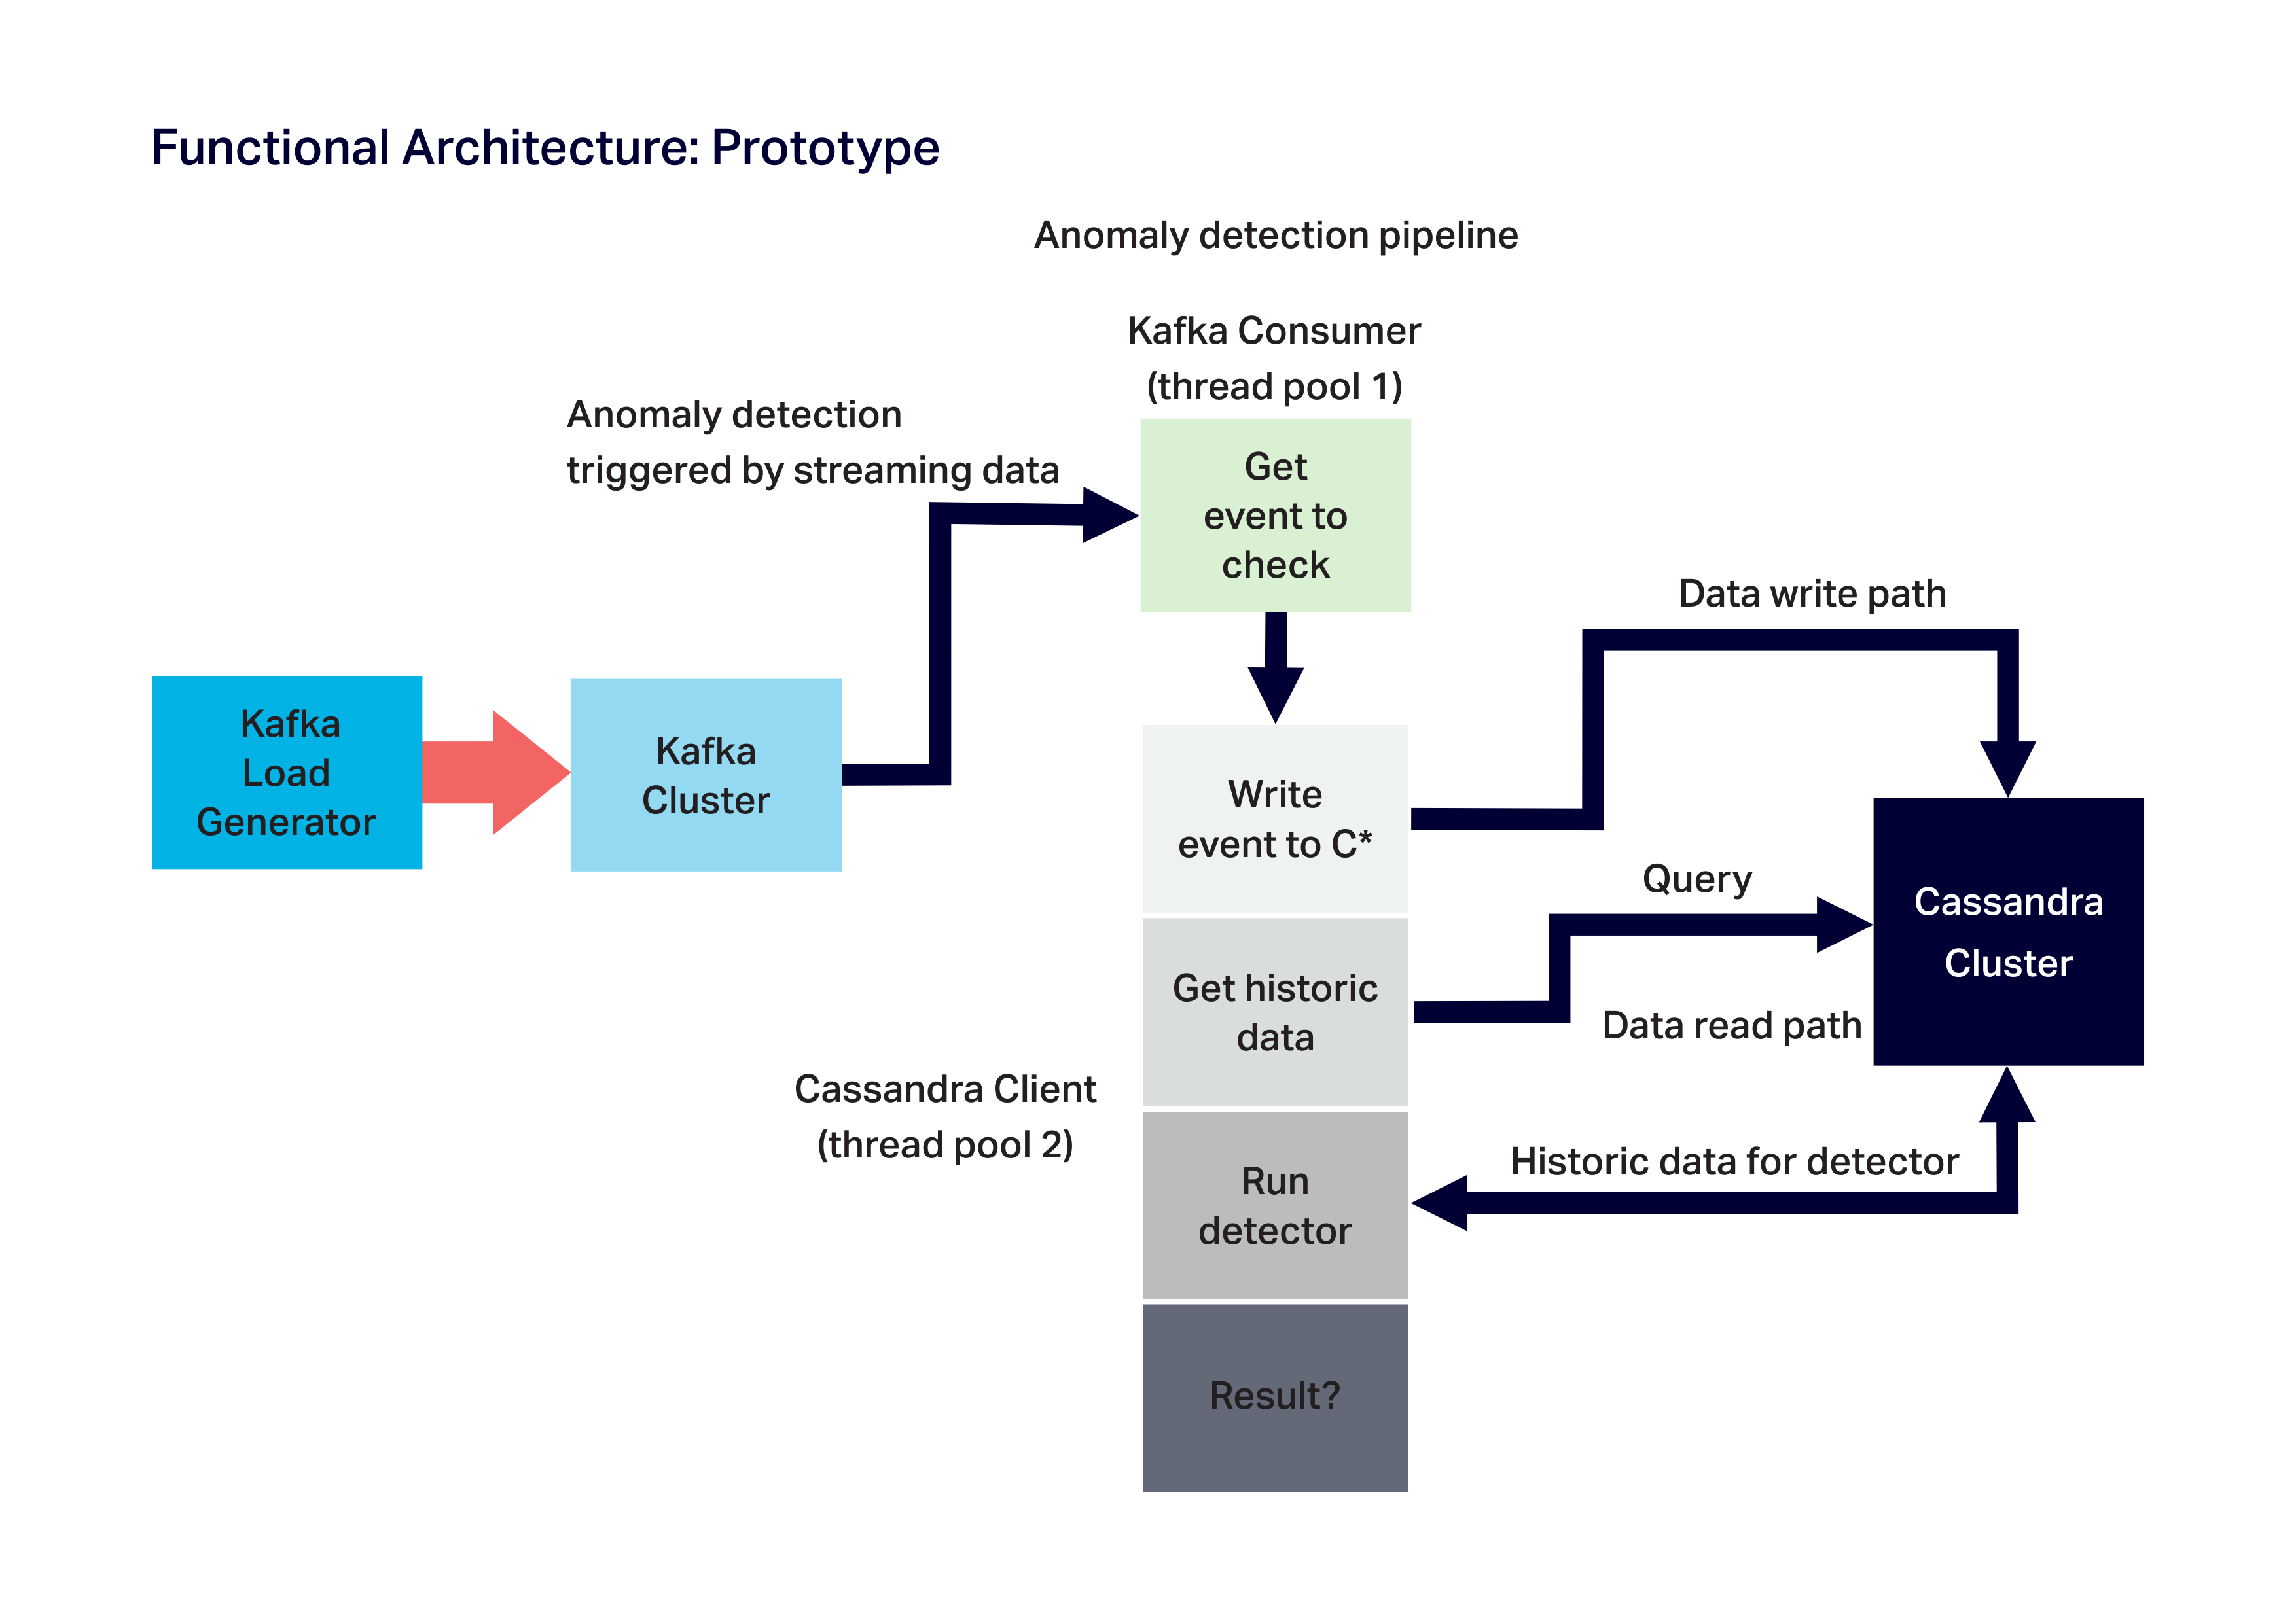
My goal was to create “life” without worrying too much about beauty. From the various raw materials on hand I fashioned some organs and cobbled them together with leftover ligaments until the “Monster” came to life (i.e. events successfully flowed end to end):
- Kafka load generator
- Anomaly detection pipeline: Kafka consumer
- Anomaly detection pipeline: Cassandra client
1.1 Kafka Load Generator (Producer)
The Kafka load generator is based on the standalone Cassandra client used in Anomalia Machina 1 to generate suitable pseudo-random event sequences with occasional anomalies but is rewritten as a multi-threaded Kafka producer which gradually ramps up the load and then runs at full load (for configurable intervals).
Metrics were also added to compute and report CPU utilisation, memory, rate of event production, and producer latency. To ensure that the load generator was resource-efficient and could produce high loads for the “Kafka as a buffer” use case (see below), we used asynchronous sends with a callback (i.e. producer.send(record, callback), rather than producer.send(record).get()which blocks), in conjunction with Java Futures to check that sends are successful, and compute the metrics: i.e.
ProducerRecord<Long, Long> r = new ProducerRecord<Long, Long>(topic, k, v);
producer.send(r,
new Callback()
{
public void onCompletion(RecordMetadata metadata, Exception e)
{
if (e != null)
{
// send failed
}
else
{
// compute metrics
}
}
}
);
The Kafka load generator connects to an Instaclustr managed Kafka cluster. We created a single topic on the cluster with a simple <key, value> record format, and events are sent to it keyed by ID.
This meant we didn’t need a custom (de-)serializer, and could just use the basic built-in ones. This design was also ready for a possible Kafka streams variant (as it’s better to have a key for streams).
The topic has sufficient partitions (90) to ensure we can scale things up on the test system (i.e. we don’t want the number of partitions to be an artificial bottleneck, or to have so many that they may cause scalability issues).
1.2 Anomaly Detector: Kafka Consumer + Cassandra Client
Two separate pieces constitute the “guts” of the anomaly detector and form a somewhat “monstrous” combination given their different origins.
The anomaly detector is implemented as two distinct loosely coupled asynchronous components.
A Kafka Consumer (repurposed from Kongo) subscribes to the topic and polls for records. Each new record returned triggers the next phase of the anomaly detector which is handled by another component based on a Cassandra Client.
This component writes the event to Cassandra, runs a query to get the historic data for the event, waits for the data, and then runs the anomaly detector code on the data producing an anomaly/not anomaly decision.
The Kafka Consumer and the Cassandra Client run in their own separate thread pools. This design was motivated by our experiences scaling Kongo.
We discovered that best practice for Kafka consumers is to minimize the processing time spent in the consumer threads, otherwise the number of consumer threads must be increased to achieve the target throughput.
However, Kafka is more scalable with fewer consumer threads. So ideally all the Kafka consumer should do is get events from topics, and immediately hand them over to other thread pools for processing.
We also added metrics to the detector pipeline including CPU and memory utilisation, Kafka consumer and detector (the Cassandra client) throughputs, anomaly rate, and end-to-end and detector latencies (from time of event production/start of the detector to the end of the detector pipeline).
Initially, I used this metrics package, but I couldn’t make sense of the throughput metrics being reported until I realised they were exponentially-weighted moving average rates which were not what I expected (or wanted).
I then wrote my own metrics package which computed throughput in units of events/s, and latency in average ms, over constant time periods (10s by default), which was a lot more useful for understanding what was happening as events flowed through the different stages of the pipeline.
2. Test Deployment and Initial Results
 (Source: Shutterstock)
I was eager to put my newly created “Monster” through its paces, and see what it was capable of on a realistic test system, so I created and configured some Instaclustr managed Kafka and Cassandra clusters on AWS, and two extra AWS instances, one for the Kafka load generator and the other for the detector pipeline application as follows:
- The Kafka cluster
- 3 node, r4.xlarge-750 (750GB Disk, 30.5GB RAM, 4 CPU cores).
- The Cassandra cluster
- 3 node, c5d.2xlarge (200GB SSD, 16GB RAM, 8 CPU cores).
- The load generator instance
- m4.10xlarge
- The detector application instance
- c5d.2xlarge.
I decided to use the anomaly detector rate (checks/s in blog 1) as the reported benchmark metric, using the 1:1 read: write ratio workload (the detector is run for every new event), as this combination is:
- The most demanding and therefore realistic workload. This results in up to 50 rows of data read for each row written to Cassandra.
- It’s also the easiest to understand, as if the detector is keeping up with the event arrivals then the system is working smoothly, but if it starts to lag behind then something has gone out of whack.
2.1 Loading initial data and tuning
To ensure that most of the data was read from disk rather than RAM (mandatory for a realistic Big Data benchmark), that a minimum of 50 records are returned for each read (so that the anomaly detector has sufficient data to make a decision), and that run results are consistent, we ran an initial write-only workload flat-out for several hours and filled up 30% of the available Cassandra disk space.
The choice of ID range (how many unique IDs) is critical for the sizing of the benchmark. Too few and the records will most likely be read from RAM. Too many and the number of records available for each ID may be less than 50.
For these tests, I used a range of 10 million, but this may need to be increased to at least 1 billion (1 x 10^9) for the massively scaled benchmarking.
Checking the benchmark results with the real mixed workload, the detector rate dropped significantly – from a peak of 13,000 TPS with minimal data to a consistent throughput of 6,000 TPS at 30% disk capacity – so the goal of pre-loading was achieved.
But, we noticed that Cassandra cluster CPU dropped significantly – from close to 100% to 60% – and we couldn’t push it up further (even using 2 application instances for the detector pipeline application code).
This suggested that some tuning was in order. We tried a recommended tuning option for read-intensive workloads which gave some benefit. Decreasing the compression chunk size to 1KB (the smallest possible value) resulted in higher CPU usage and an increase in throughput to 9,000 TPS.
The Apache Cassandra documentation explains the benefits of compression as follows:
“Compression’s primary benefit is that it reduces the amount of data written to disk. Not only does the reduced size save in storage requirements, it often increases read and write throughput, as the CPU overhead of compressing data is faster than the time it would take to read or write the larger volume of uncompressed data from disk.”
There is more information here, and from Ben Bromhead, Instaclustr’s CTO (who also suggests dropping the readahead value for SSDs, I’ll try this next round of tests).
3. “Kafka as a Buffer” Use Case
 (Source: Shutterstock)
What do you do when an unexpected angry mob arrives at your castle gates? Buffer them!
Finally, we wanted to check how well the pipeline works with the “Kafka as a buffer” use case, i.e. when there is a brief, but massive, increase in events hitting the system in excess of what the anomaly detection pipeline can keep up with, and which is then absorbed by Kafka allowing subsequent leisurely processing by the pipeline.
What do we expect to see happen? The producer and detector rates will ramp up gradually and will increase in step until the maximum capacity of the anomaly detector pipeline is reached.
The detector rate will then flatline at the maximum capacity while the producer rate keeps increasing to the maximum load. The detector rate will stay flatlined until it catches up and processes all the events. The end-to-end and detector latencies will increase, although the detector rate should not continue to increase once the steady-state average is reached.
For this simple test well try a load spike into Kafka of about double the anomaly detector pipeline maximum capacity.
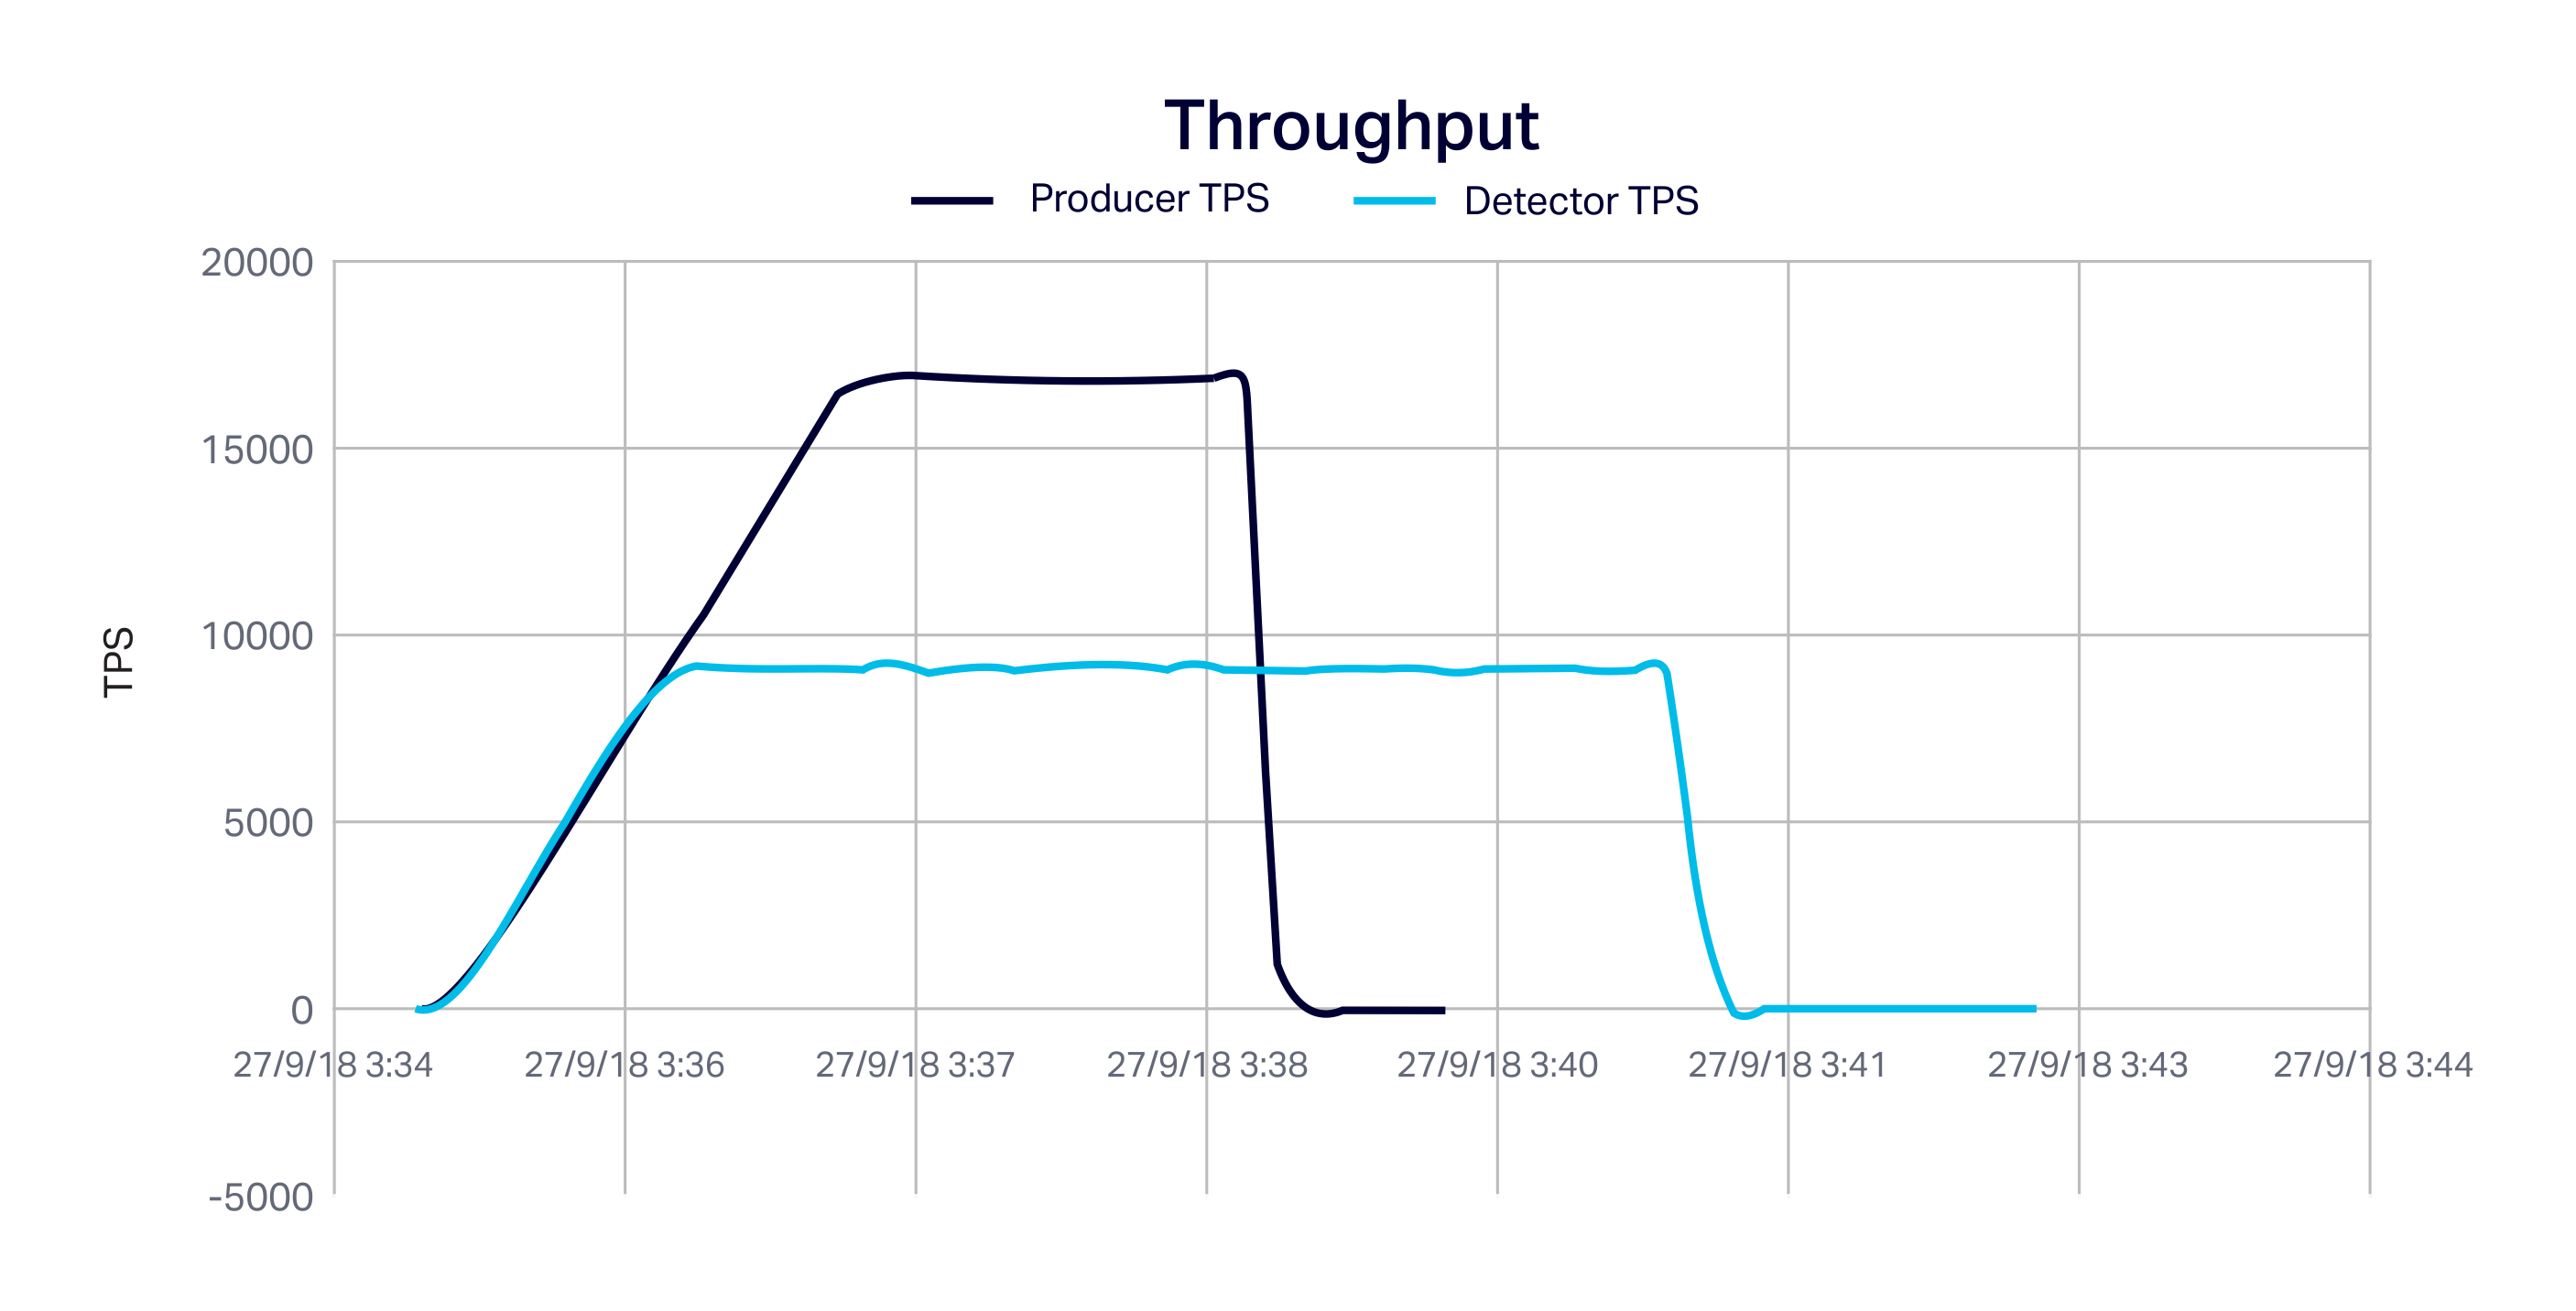
The following graph shows the Kafka producer throughput and the detector throughput. The producer rate ramps up and the detector rate keeps up until 9,000 TPS.
As the producer keeps on increasing above 9,000 TPS the detector flat lines (as this is the maximum detector capacity). The producer reaches maximum load (17,000 TPS) and keeps running for a couple of minutes and then drops to zero. The detector keeps processing events until there are none remaining and then stops as well.
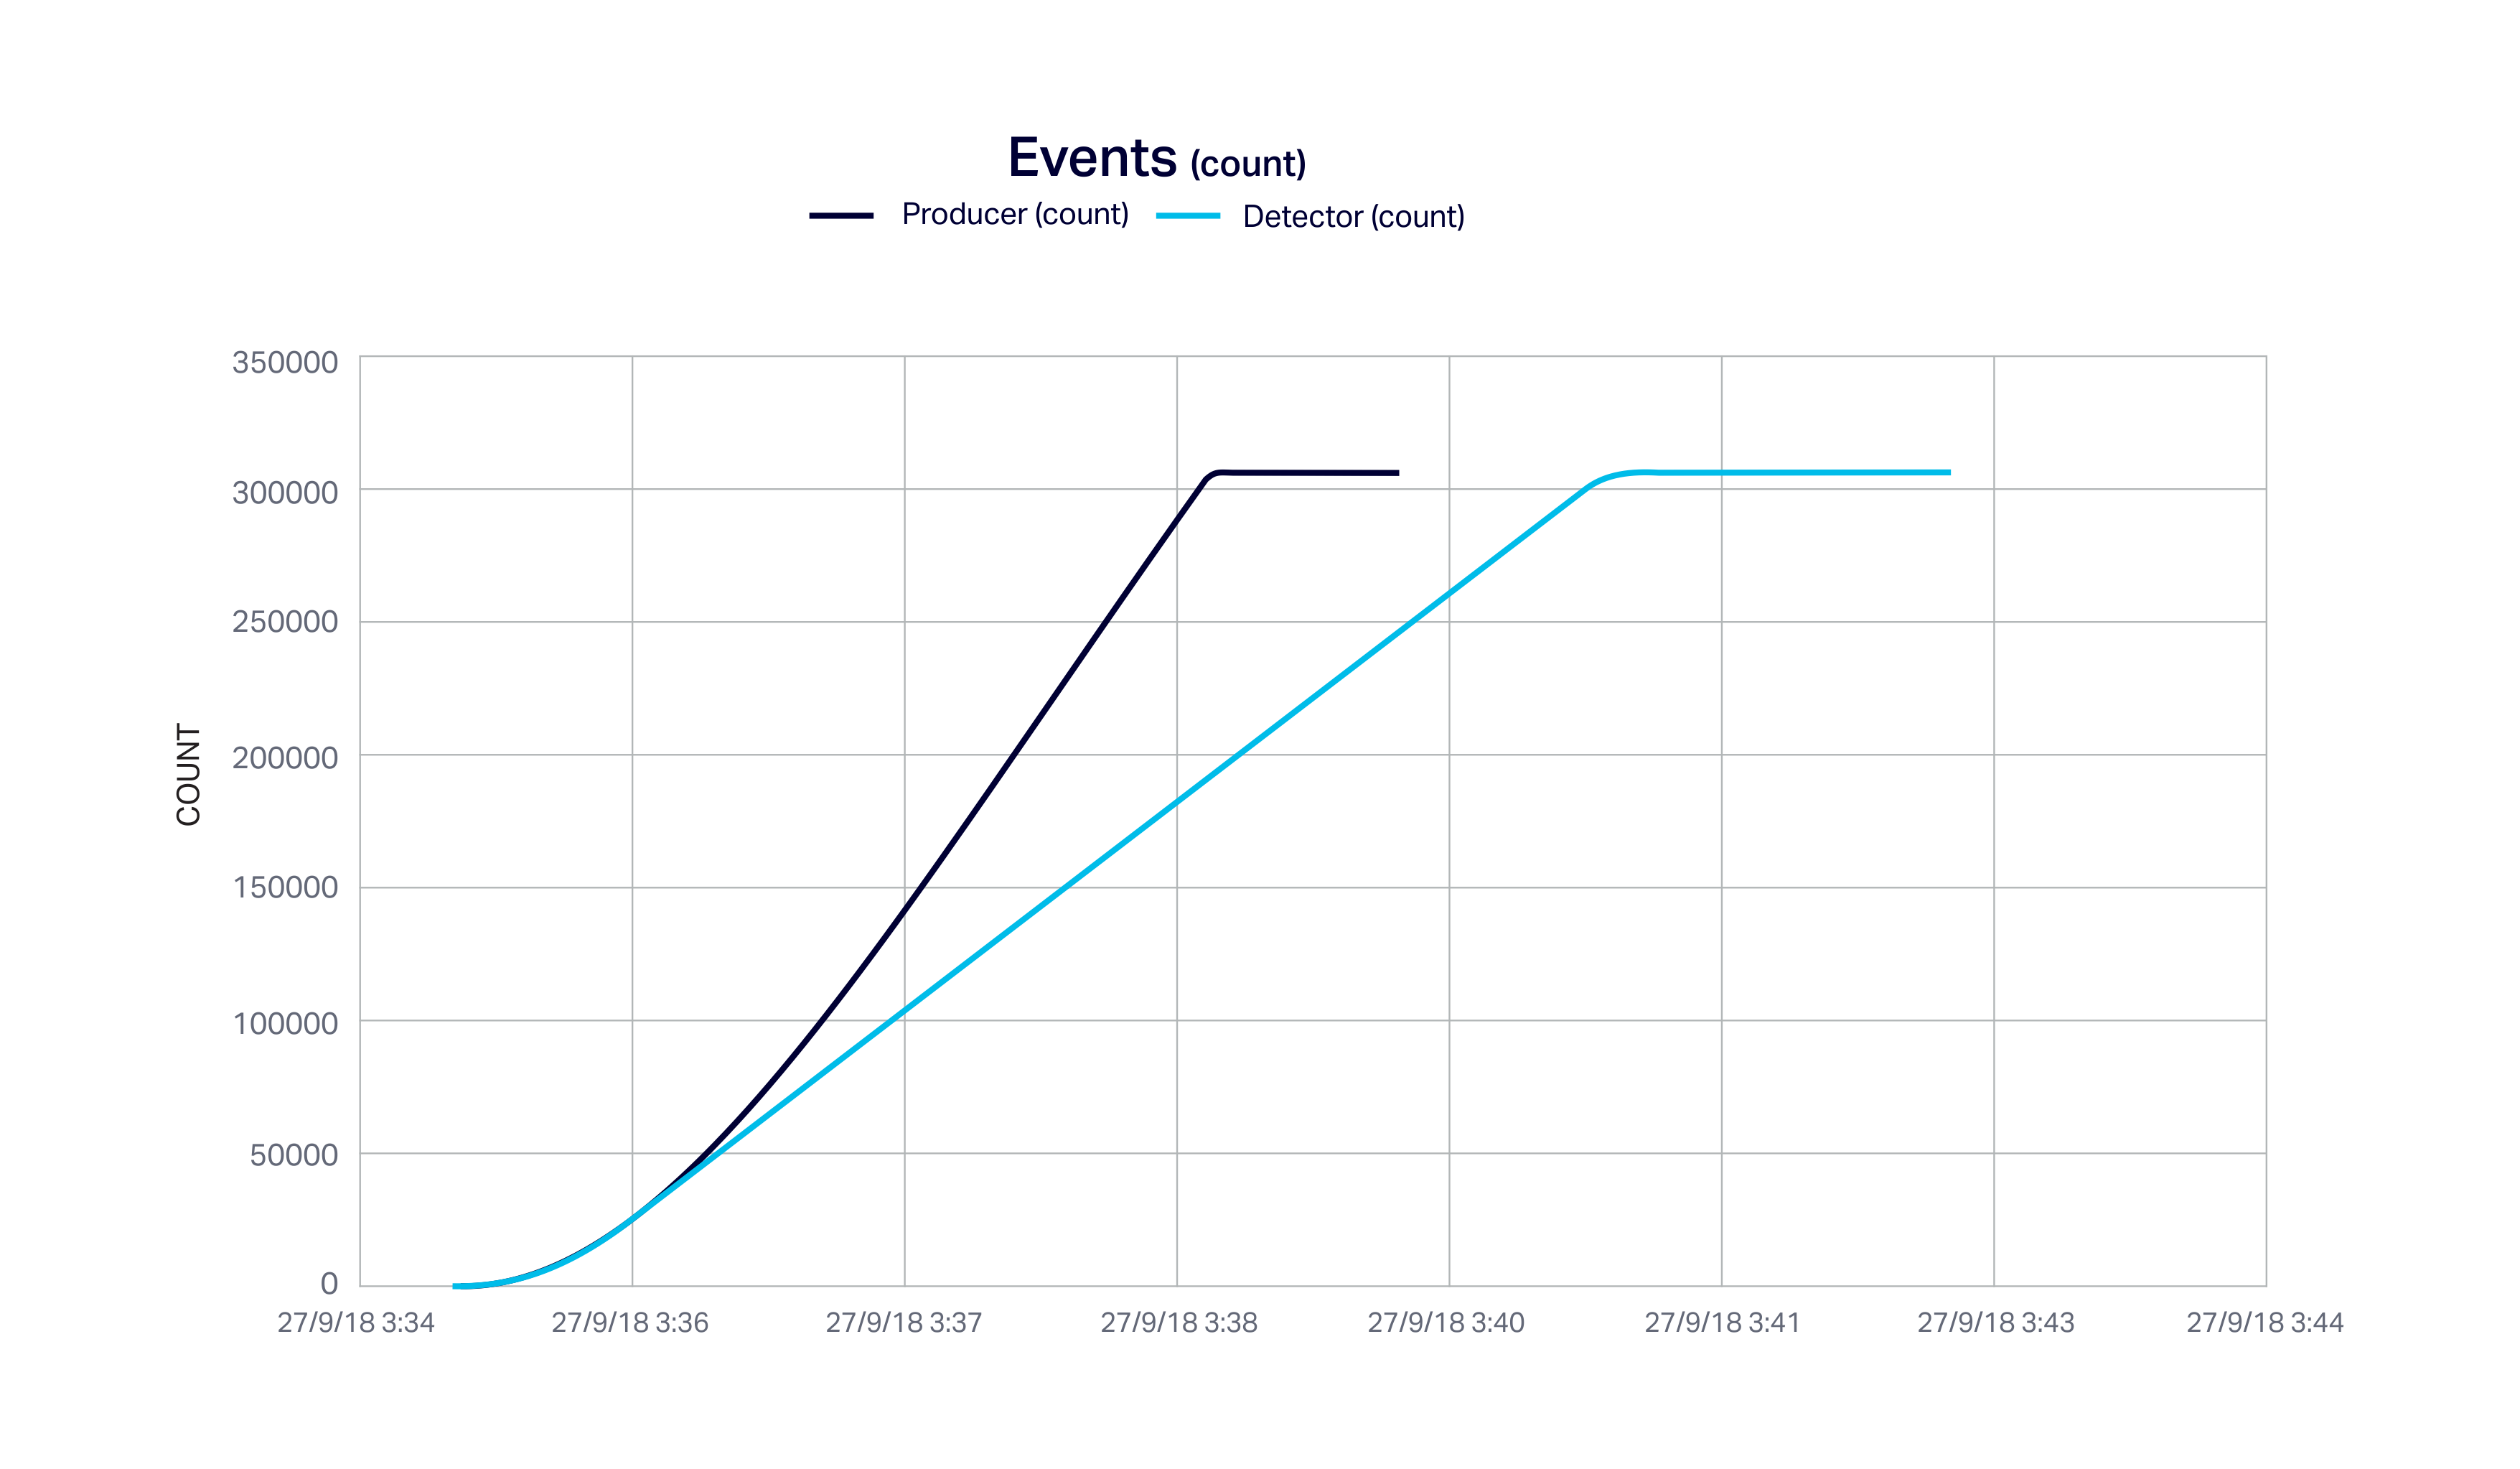
This next graph shows the same thing but in terms of cumulative count. Once the producer rate exceeds the detector rate the counts diverge until the detector catches up several minutes later. The shows that the Kafka buffer is working perfectly and all events received are eventually processed through the pipeline.
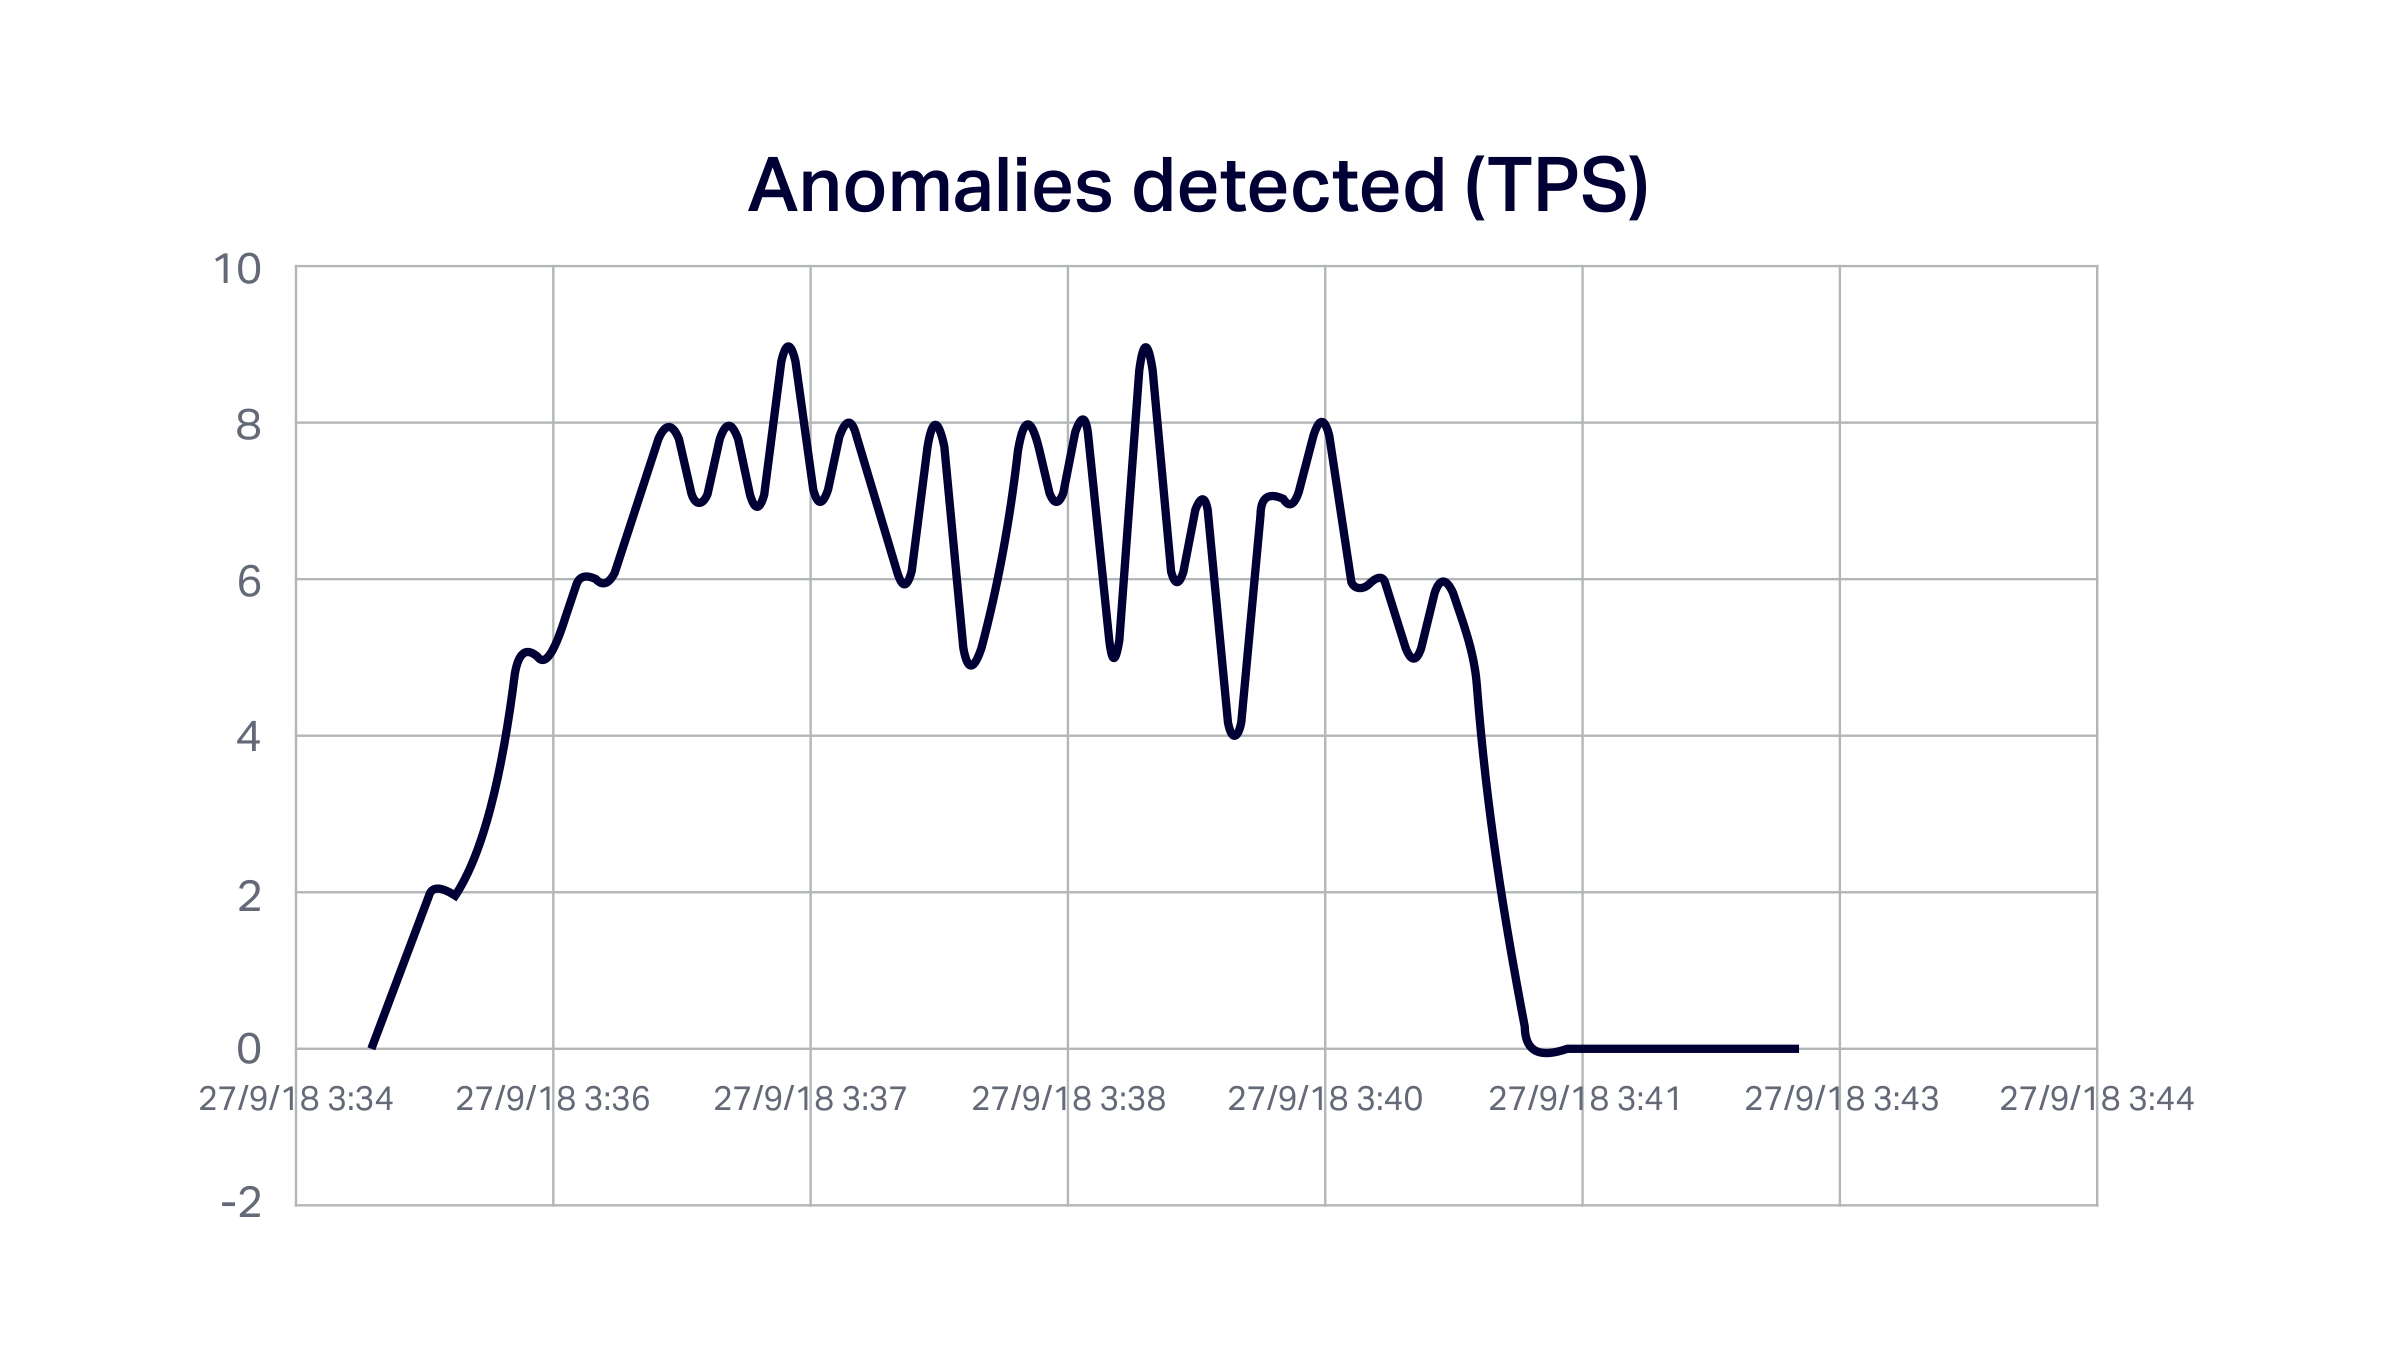
The following graph shows the rate of anomalies detected (just to prove that it’s really working):
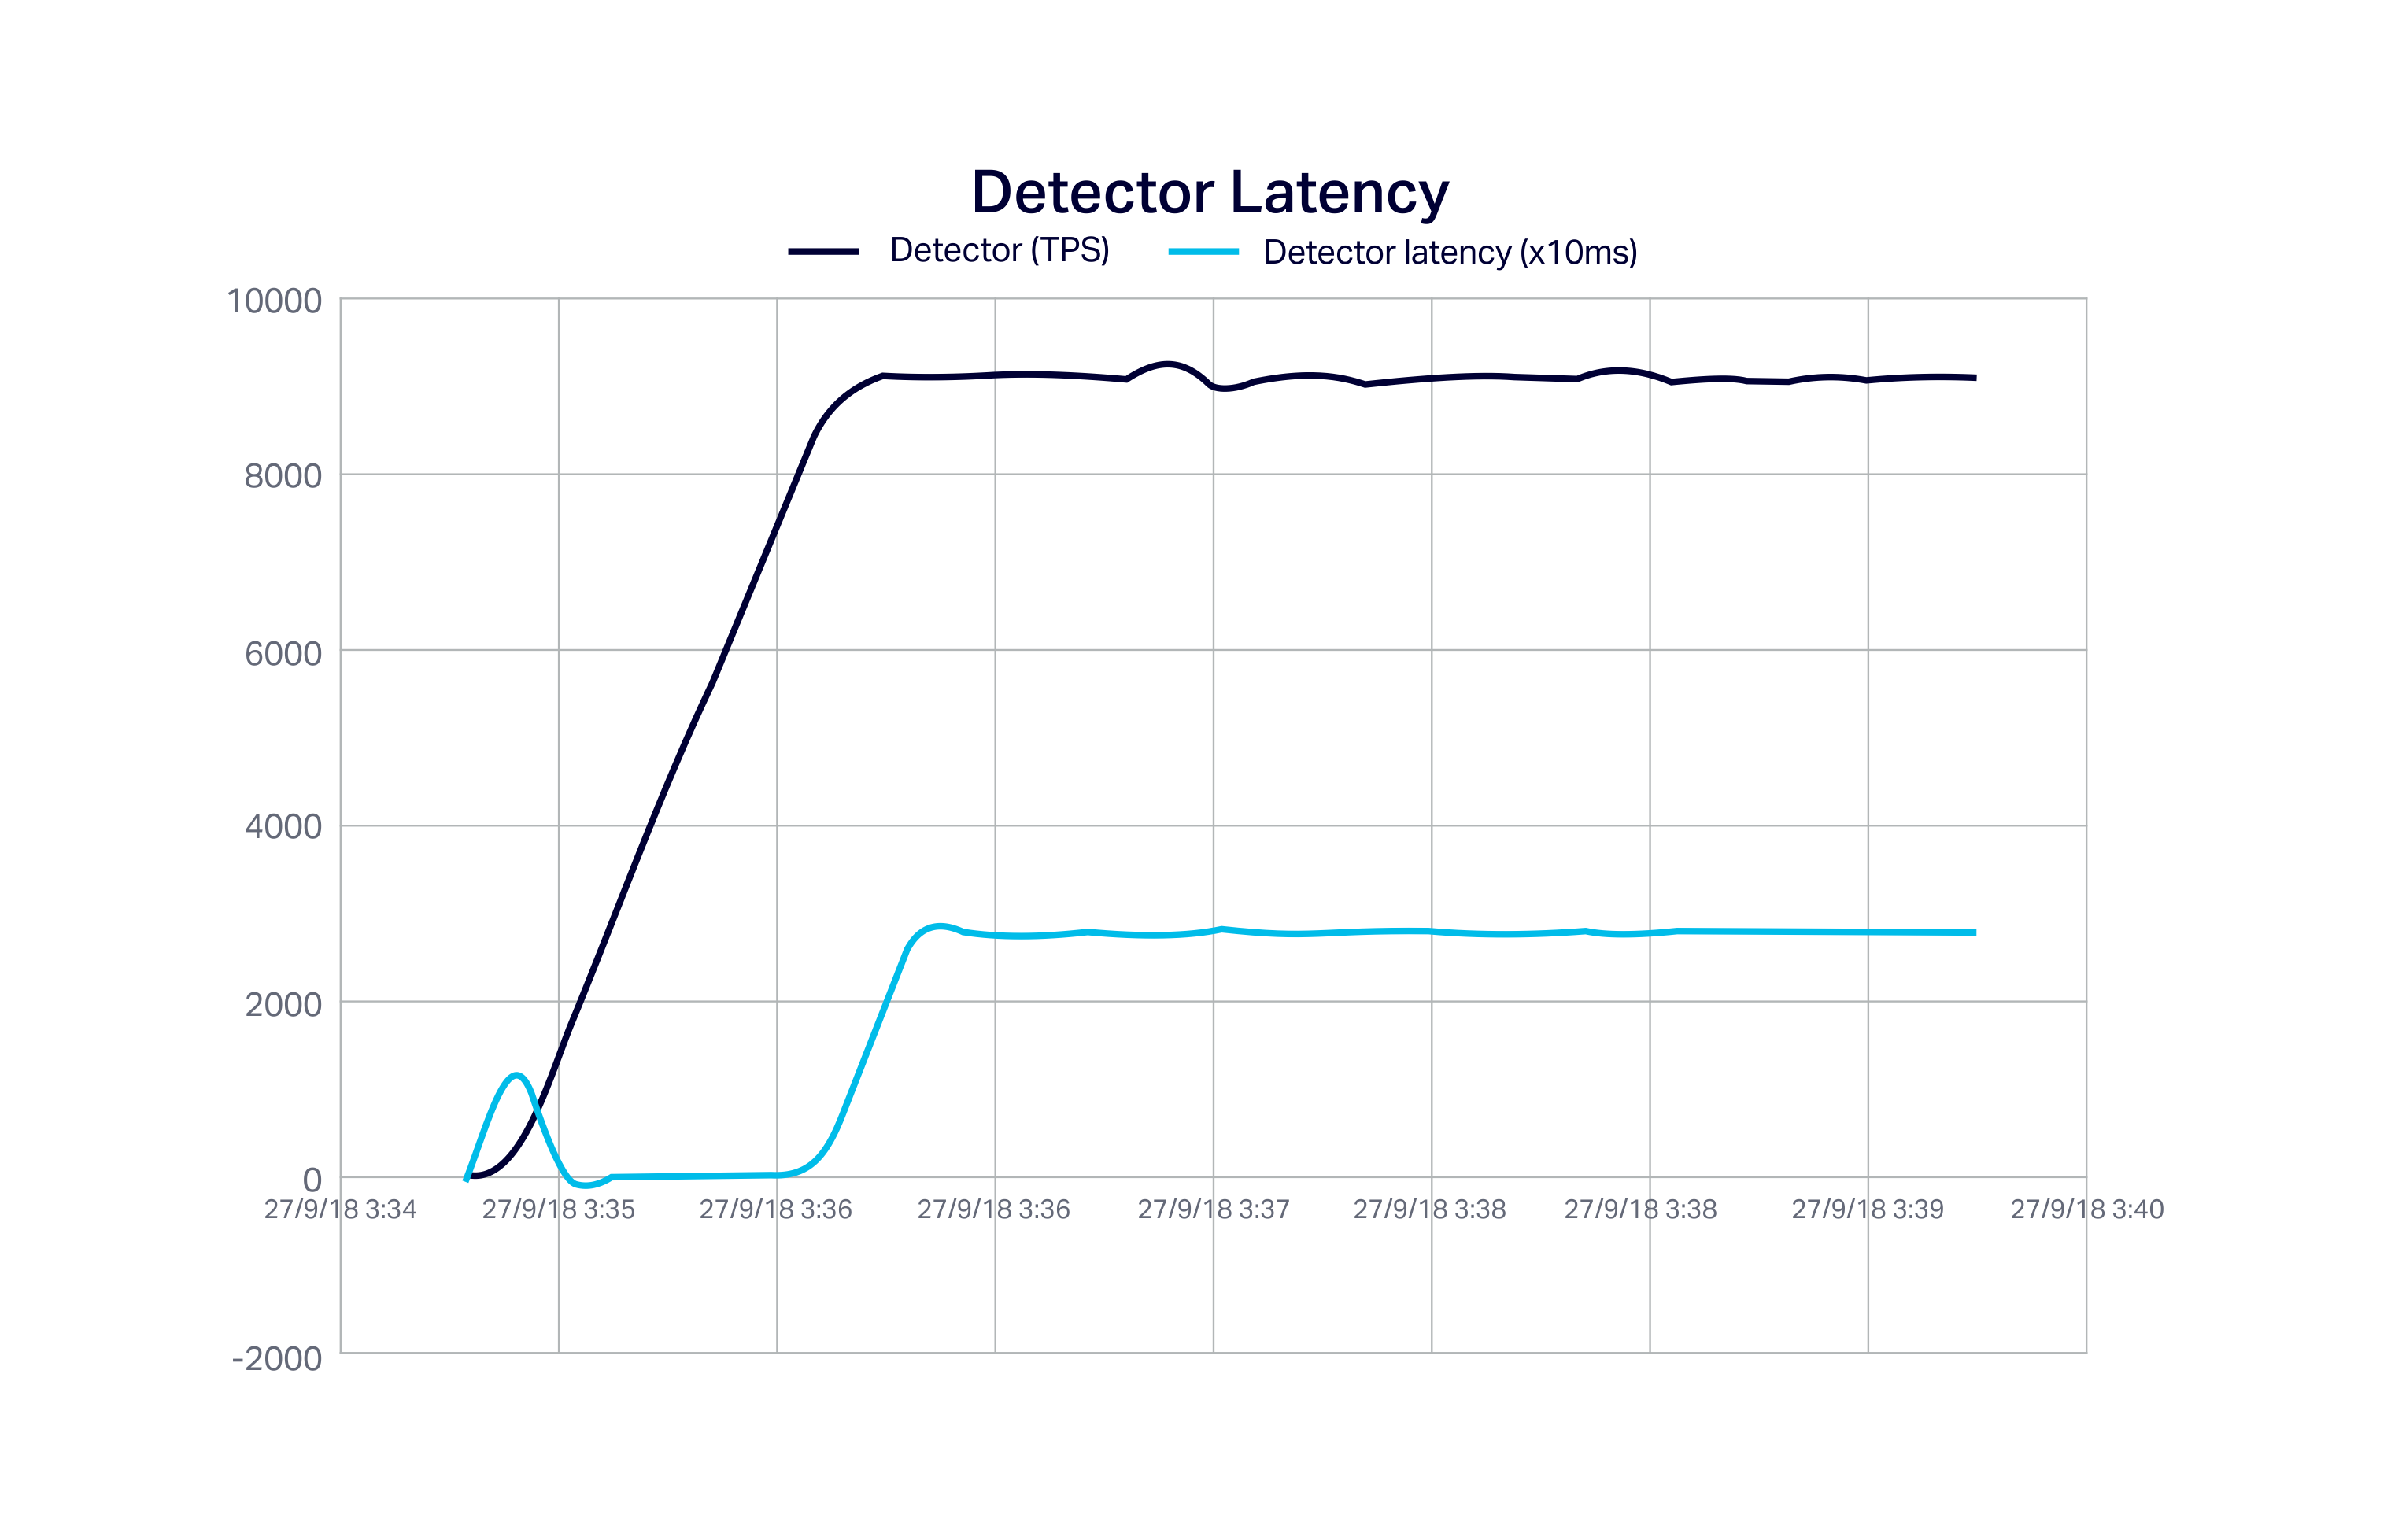
This graph shows the ramp-up of the detector load (blue line), and the increase in the detector latency (orange) from 2ms at low load, to a steady-state average of 280ms (note ms scale is x10 on graph) at full load. There is a small spike in latency at the start of the run due to an initial delay due to obtaining Cassandra connections:
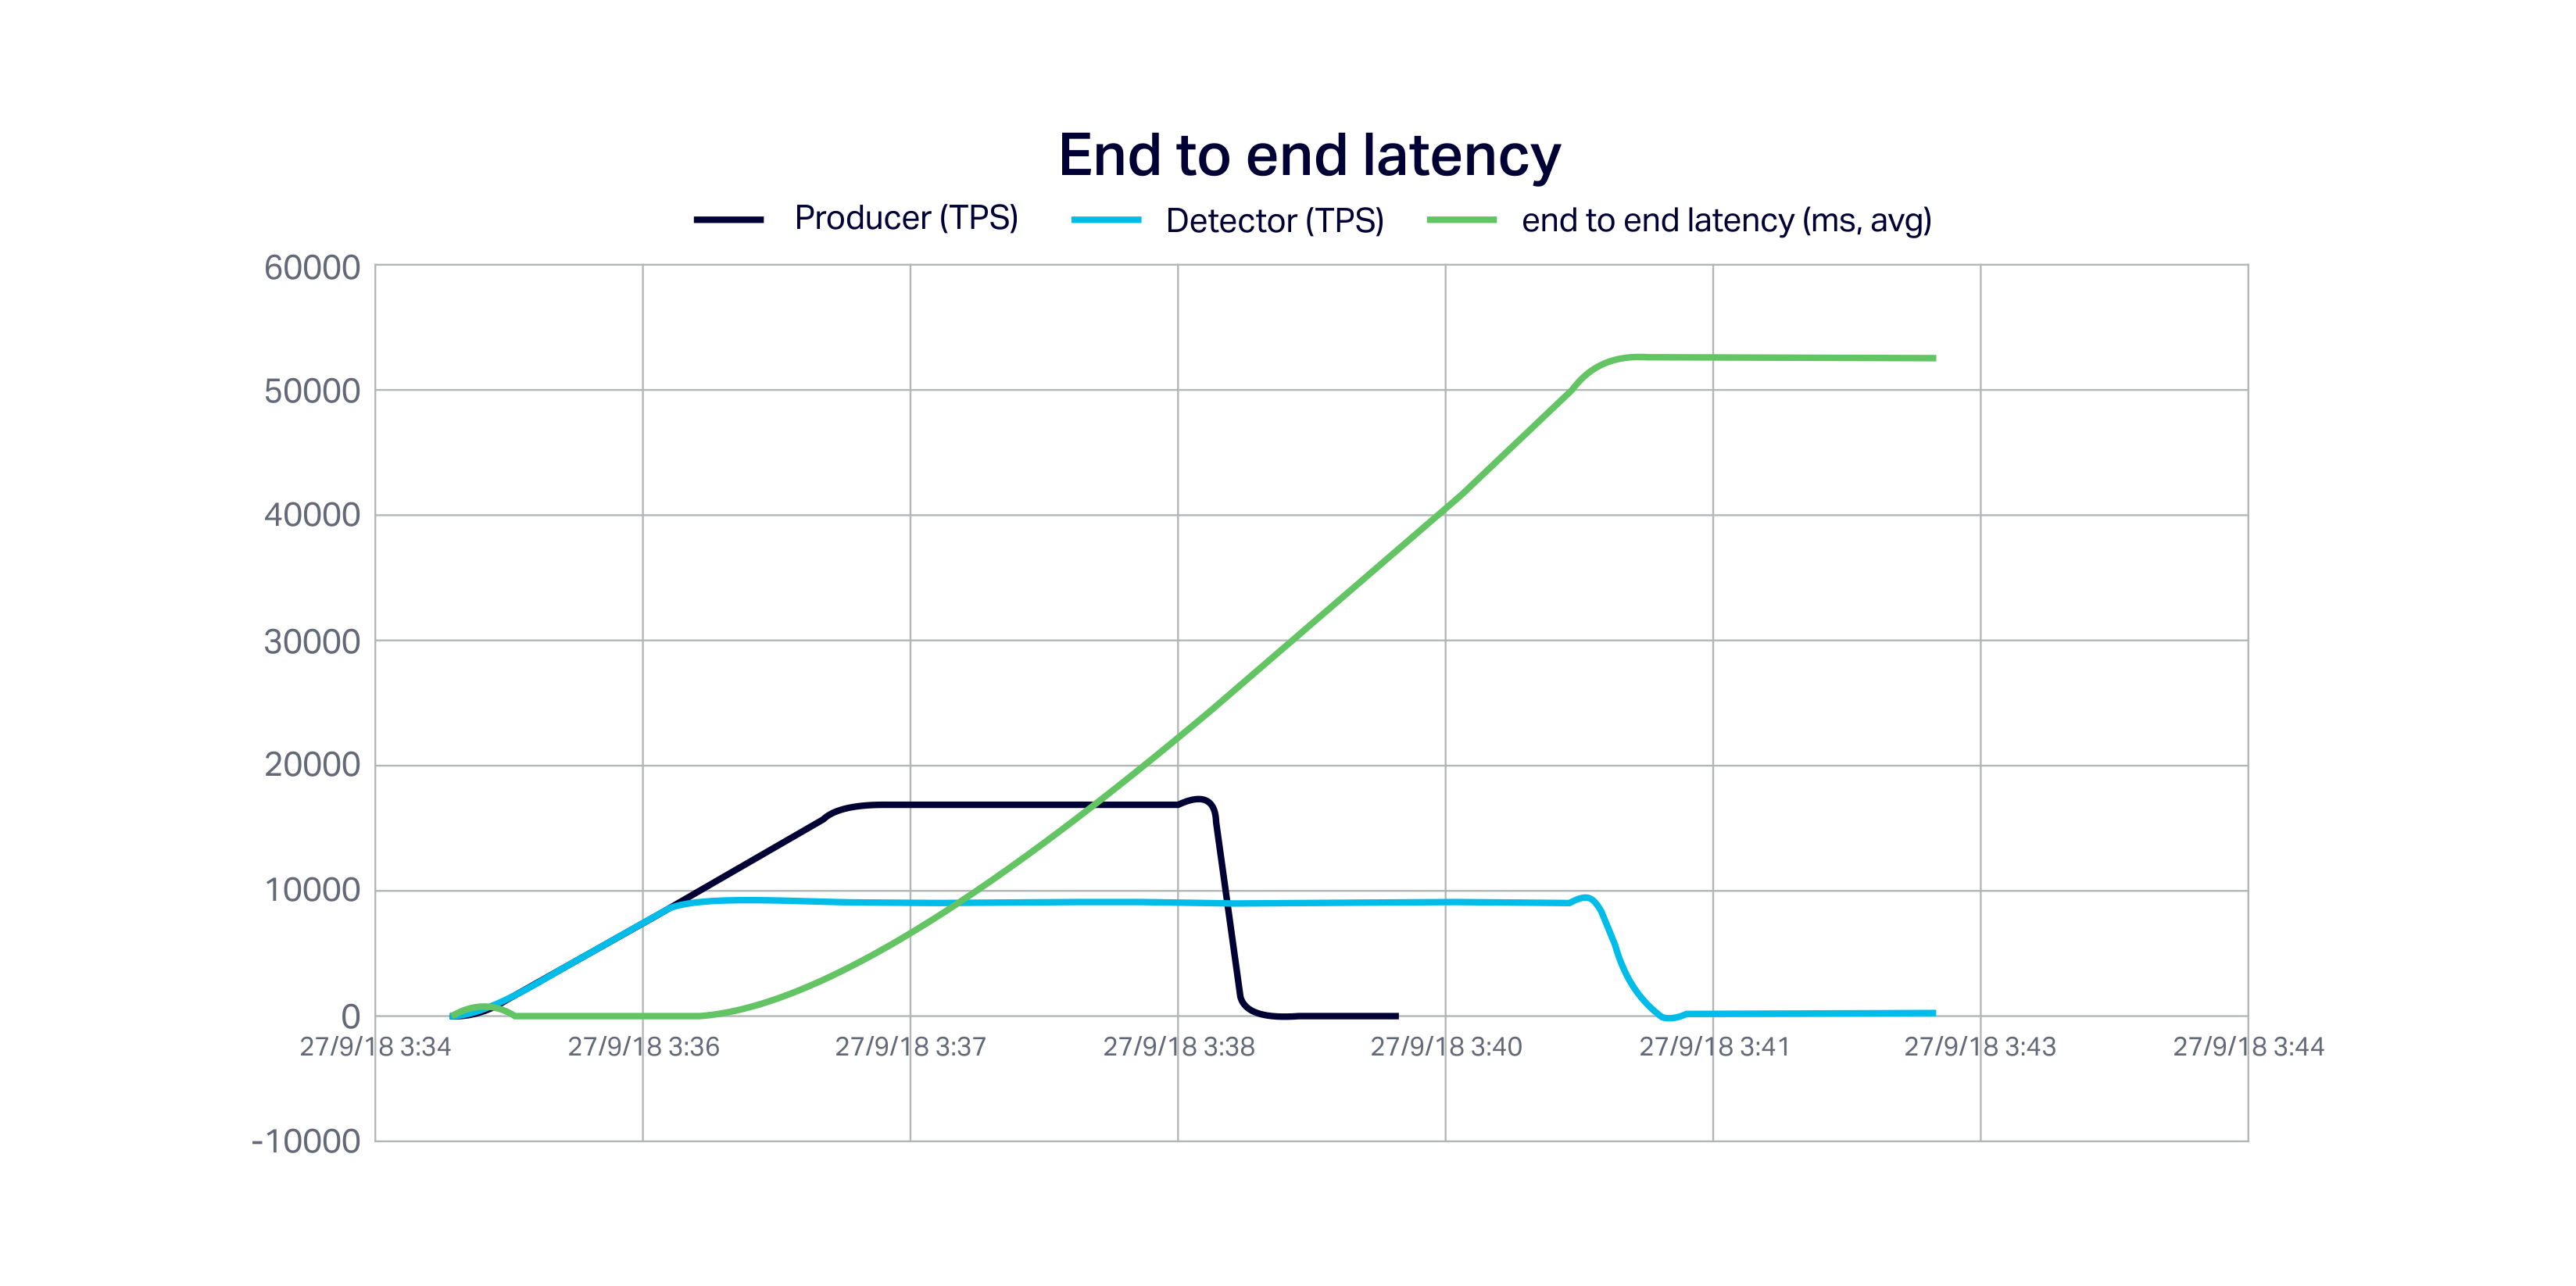
The final graph shows the “complication” from the system perspective.
The average end-to-end latency of the complete pipeline increases from 8 milliseconds to around 52 seconds once the detector can no longer keep up with the producers.
Obviously, if we are expecting the detector to make a decision within say a few seconds of each event being produced then we will be disappointed. This is probably too slow and we will need to increase the anomaly detector pipeline resources ( application instances and Cassandra capacity).
How far can we push our “Monster”? What’s the maximum load spike that Kafka can handle? A lot!
In fact, it’s very hard to “break” Kafka (I haven’t managed to yet). We can push this Kafka cluster to as high as 2 million events/s with no hiccups (in Kafka at least, but see below). The side-effect is that it takes hours for the rest of the pipeline to process all the events with the current resources.
4. Postscript
Unpleasantly, getting the “Kafka as a buffer use case” working and testing it revealed some hideous deformities in my creation.
Firstly, the end-to-end latencies were negative! Obviously, the times on the Kafka producer and Detector application servers were different. We had to synchronize times on the AWS application servers.
Behind the scenes, a useful thing Instaclustr does for their Cassandra and Kafka customers is cluster time synchronization using our own ntp cluster.
It’s also possible for Instaclustr’s customers to use the private Instaclustr ntp service to synchronize the time on their application servers with the Cassandra and Kafka clusters they are using.
Details of the Instaclustr ntp service are available upon request, and you just have to replace the AWS ntp server in this line in the /etc/chrony.conf file:
server 169.254.169.123 prefer iburst
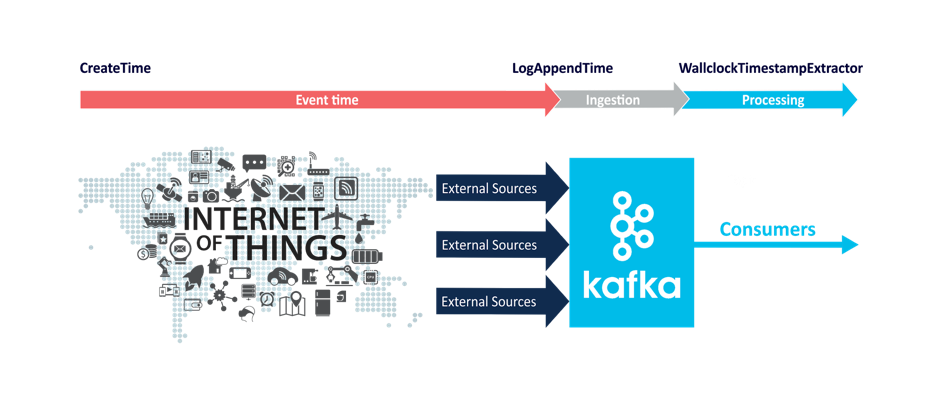
This would be particularly useful if you are using combinations of Kafka time semantics which use times from outside (event or processing time) and inside the Kafka cluster (ingestion time): (CreateTime OR Wallclock time) AND LogAppendTime.
Here’s the diagram from an earlier blog which explains things well:
Secondly, it was apparent that the Cassandra client thread pool was becoming engorged!
The thread pool for the Kafka consumer was fixed sized (set to a realistic working number by default), but the thread pool for the Cassandra client was dynamic and demand-driven.
This worked as expected normally (if the detector pipeline could easily keep up with the rate of events coming into Kafka), but if the rate of events into Kafka suddenly increased then the Kafka consumer suddenly received a large number of events and immediately passed them to the detector thread pool, which suddenly massively inflated in size.
This had 2 side-effects:
- The Kafka consumer thread pool suffered resource starvation, resulting in the consumer throughput dropping substantially (to close to zero), and
- The detector latency increased massively. I changed the dynamic thread pool to fixed size, and also introduced a throttle between the two components which fixed this problem. However, removing the dynamic pool sizing means that we must remember to manually tune the thread pools for different loads.
 (Source: Wikipedia)
Let’s leave the last word to the “Monster”:
‘Hateful day when I received life!’ I exclaimed in agony. ‘Accursed creator! Why did you form a monster so hideous that even you turned from me in disgust?’
― Mary Shelley, Frankenstein
What’s Next?
While I’ve been working away in the laboratory, Anup has been working on the automation aspects of the project, including provisioning Cassandra and Kafka clusters, and using JMeter as a load generator for Kafka.
I’ve also started to investigate using Kubernetes to scale out the anomaly detection pipeline, which will hopefully make it less monstrous and even a thing of automated machine beauty.
I’ll also look at using Open Source monitoring to integrate the Cassandra and Kafka cluster metrics with the Anomalia Machina application metrics. And then we’ll bring it all together and crank out some large anomaly detection numbers.